Qatar 3D Printing Ceramic Market (2026-2032) | Consumer Insights, Strategic Insights, Competitive, Strategy, Competition, Industry, Restraints, Value, Opportunities, Size, Demand, Forecast, Companies, Revenue, Pricing Analysis, Supply, Drivers, Trends, Outlook, Challenges, Share, Segments, Segmentation, Investment Trends, Growth, Analysis
Market Forecast By Material (Alumina, Zirconia, Silica), By Application (Aerospace, Medical Devices, Electronics) And Competitive Landscape
| Product Code: ETC11537955 | Publication Date: Apr 2025 | Updated Date: Jun 2026 | Product Type: Market Research Report | |
| Publisher: 6Wresearch | Author: Bhawna Singh | No. of Pages: 70 | No. of Figures: 35 | No. of Tables: 5 |
Qatar 3D Printing Ceramic Market Growth Rate
According to 6Wresearch internal database and industry insights, the Qatar 3D Printing Ceramic Market is projected to grow at a compound annual growth rate (CAGR) of 10.6% during the forecast period (2026–2032).
Qatar 3D Printing Ceramic Market Year-wise Growth Rate and Key Drivers
This graph highlights how the Qatar 3D Printing Ceramic Market has steadily grown over the past five years, supported by major growth factors.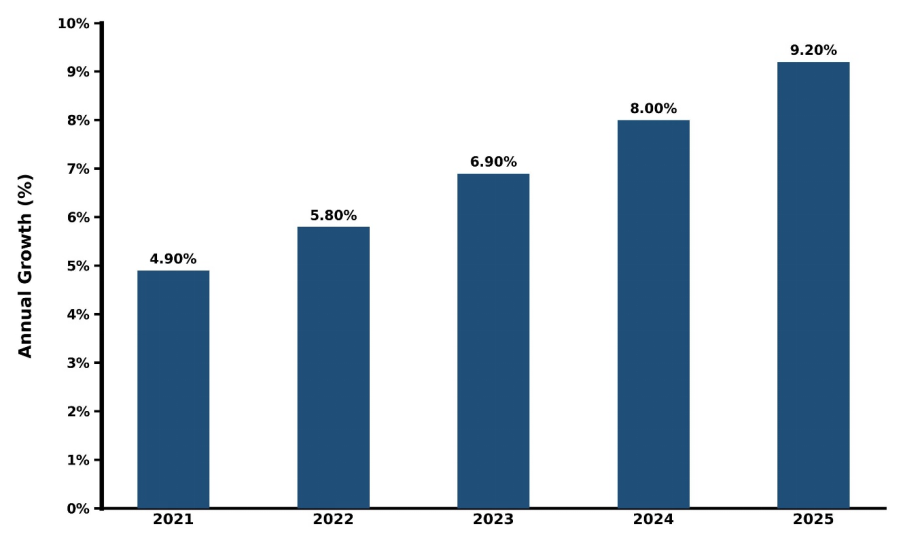
Below mentioned are the evaluation of year-wise growth rate along with key drivers:
| Year | Est. Annual Growth (%) | Growth Drivers |
| 2021 | 4.9% | Experimental use of ceramic printing confined to controlled R&D environments focused on material feasibility validation. |
| 2022 | 5.8% | Early industrial validation of sintered ceramic parts in non-load-critical aerospace and electronics housings. |
| 2023 | 6.9% | Gradual migration from prototype-only usage toward functional ceramic part testing in regulated environments. |
| 2024 | 8% | Qualification of zirconia-based printed geometries for precision medical tooling and implant prototyping cycles. |
| 2025 | 9.2% | Integration of ceramic additive workflows into limited production lines for high-spec industrial components. |
Topics Covered in the Qatar 3D Printing Ceramic Market Report
The report covers the market by material and application. It provides a detailed analysis of material-level performance evolution, application-specific adoption dynamics, and technology-driven transformation influencing Qatar’s advanced ceramic manufacturing ecosystem.
Qatar 3D Printing Ceramic Market Highlights
| Report Name | Qatar 3D Printing Ceramic Market |
| Forecast period | 2026-2032 |
| CAGR | 10.6% |
| Growing Sector | Advanced Ceramics, Aerospace & Medical Engineering |
Qatar 3D Printing Ceramic Market Synopsis
The structural character of the Qatar 3D Printing Ceramic Market is defined less by volume expansion and more by material capability displacement—where ceramics produced via additive manufacturing are replacing conventionally pressed or cast components in performance-sensitive environments. Unlike polymer or metal printing ecosystems, ceramic additive manufacturing is governed by post-processing dependency chains (debinding and sintering), which inherently restrict scalability but simultaneously elevate entry barriers and product value density. This creates a market structure where growth is concentrated in high-specification micro-industries rather than broad manufacturing diffusion.
Evaluation of Growth Drivers in Qatar 3D Printing Ceramic Market (2026–2032)
Below are some major drivers and their influence on the Qatar 3D Printing Ceramic Market dynamics:
| Drivers | Primary Segment Affected | Why It Matters (Evidence) |
| Transition from Machined to Geometry-Engineered Ceramics | Aerospace | Additive ceramics enable lattice and hollow geometries impossible under subtractive machining constraints. |
| Biological Interface Engineering in Implants | Medical Devices | Zirconia printing enables patient-specific morphological adaptation rather than standardized implant sizing. |
| Thermal-Electronic Convergence Requirements | Electronics | Ceramic substrates are increasingly required to manage heat dissipation in compact semiconductor architectures. |
| Decoupling of Design Complexity from Manufacturing Cost | Alumina | Complexity no longer scales linearly with production cost under additive workflows. |
| Institutional Push Toward High-Precision Manufacturing Ecosystems | Industrial Policy Layer | National industrial strategy is prioritizing advanced material sovereignty over volume-based manufacturing. |
The Qatar 3D Printing Ceramic Market is expected to expand at a CAGR of 10.6% during 2026–2032. It is owing to with growth structurally anchored in functional material substitution rather than the demand expansion alone. This is particularly across aerospace thermal systems, precision medical engineering, and high-frequency electronic insulation architectures. Additionally, the market is witnessing a gradual transition toward performance-led material engineering. It is where ceramics are highly selected for their ability to deliver reliability under extreme thermal, mechanical, and electrical stress conditions.
Evaluation of Restraints in Qatar 3D Printing Ceramic Market
Below are some major restraints and their influence on the Qatar 3D Printing Ceramic Market dynamics:
| Restraints | Primary Segment Affected | What This Means (Evidence) |
| Sintering-Induced Shrinkage Variability | Alumina & Zirconia | Dimensional instability during thermal consolidation limits repeatability in precision manufacturing. |
| Multi-Stage Production Fragility | All Segments | Printing → debinding → sintering sequence introduces cumulative defect risk at each transition layer. |
| Low Throughput Economics | Aerospace | Unit production time remains significantly higher than metal or polymer additive systems. |
| Qualification Bottlenecks in Regulated Industries | Medical Devices | Certification cycles are longer due to limited historical performance datasets for printed ceramics. |
| High Sensitivity to Powder Morphology | Electronics | Particle uniformity directly impacts dielectric performance and structural integrity. |
Qatar 3D Printing Ceramic Market Challenges
The principal constraint in the Qatar 3D Printing Ceramic Industry is not technological immaturity but process fragility under scale pressure. Ceramic additive manufacturing operates within a narrow stability window where thermal gradients, particle distribution, and binder chemistry must remain tightly controlled across sequential production stages. A second structural challenge lies in the absence of standardized qualification pathways for printed ceramics in mission-critical sectors. Unlike metals, ceramic performance datasets are still fragmented, which limits institutional confidence in long-cycle deployment.
Qatar 3D Printing Ceramic Market Trends
The following are key trends that influence the Qatar 3D Printing Ceramic Market:
- Function-First Ceramic Design Paradigm: Ceramics are increasingly engineered for dielectric, thermal, or biological function rather than structural use.
- Decoupling of Geometry and Manufacturability: Complex internal lattice structures are becoming standard design inputs rather than exceptions.
- Shift Toward Bio-Adaptive Ceramic Surfaces: Medical applications are moving toward patient-specific morphological matching using zirconia-based systems.
- Thermal Management Centrality in Electronics: Ceramic substrates are becoming critical in heat-dense semiconductor packaging environments.
Investment Opportunities in the Qatar 3D Printing Ceramic Market
Certain possible investment opportunities available in the Qatar 3D Printing Ceramic Market are listed below:
- High-Purity Ceramic Powder Refinement Systems: Investment opportunity lies in controlling upstream material morphology, which dictates final part integrity.
- Medical-Grade Ceramic Certification Ecosystems: Establishment of localized validation labs for implant-grade additive ceramics.
- Aerospace Ceramic Thermal Architecture Design: Development of geometry-optimized heat shielding components using alumina-based lattices.
Top 5 Leading Players in Qatar 3D Printing Ceramic Market
Below is a list of prominent companies dominating the Qatar 3D Printing Ceramic Market:
1. Nano Dimension
| Company Name | Nano Dimension |
|---|---|
| Established Year | 2012 |
| Headquarters | Ness Ziona, Israel |
| Website | Click Here |
Nano Dimension is a worldwide pioneer in Additively Manufactured Electronics (AME), enabling the simultaneous 3D printing of conductive and dielectric materials.
2. Optomec
| Company Name | Optomec |
|---|---|
| Established Year | 1997 |
| Headquarters | Albuquerque, United States |
| Website | Click Here |
Optomec is a dominant industrial additive manufacturing company known for its Aerosol Jet technology, which enables direct printing of electronic circuitry, sensors, and antennas onto complex 3D surfaces.
3. Voltaat
| Company Name | Voltaat |
|---|---|
| Established Year | 2018 |
| Headquarters | Doha, Qatar |
| Website | Click Here |
Voltaat is a regional technology provider having an expertise in electronics education kits, IoT components, and 3D printing solutions.
4. Vectorize
| Company Name | Vectorize |
|---|---|
| Established Year | N/A |
| Headquarters | Doha, Qatar |
| Website | - |
Vectorize is a Qatar-based additive manufacturing service provider catering end-to-end 3D printing solutions including rapid prototyping, product development, and low-volume production.
5. GORD 3D (Gulf Organisation for Research & Development)
| Company Name | GORD 3D (Gulf Organisation for Research & Development) |
|---|---|
| Established Year | 2009 |
| Headquarters | Qatar Science & Technology Park, Doha, Qatar |
| Website | Click Here |
GORD 3D functions as an advanced innovation and research hub focused on sustainable and high-performance additive manufacturing technologies.
Government Initiatives in The Qatar 3D Printing Ceramic Market
According to Qatar’s government data, industrial diversification strategy under National Vision 2030 is increasingly focused on high-value manufacturing ecosystems, particularly advanced materials and precision engineering sectors. Government-backed institutions are encouraging ceramic additive manufacturing through research funding, industrial incubation programs, and technology transfer partnerships. For instance, Qatar Science & Technology Park (QSTP) is helping enabling partnership between global ceramic technology firms and local research entities to spurr material qualification cycles. Additionally, the Qatar Free Zones Authority is facilitating foreign direct investment in advanced manufacturing facilities emphasised on aerospace-grade and biomedical ceramic production systems.
Sources: https://qfz.gov.qa/
Future Insights of the Qatar 3D Printing Ceramic Market
The Qatar 3D Printing Ceramic Market Growth is expected to increase. The industry is predicted evolve toward vertically integrated ceramic manufacturing ecosystems where material synthesis, printing, and post-processing converge into unified production systems. Future growth will be shaped by advancements in multi-material ceramic printing, AI-driven process optimization, and real-time sintering control technologies. A significant shift is expected in aerospace and medical sectors, where ceramic components will move from auxiliary roles to primary functional architectures in high-performance systems. Over time, the market will increasingly be defined by material intelligence rather than machine capability.
Market Segmentation Analysis
The report offers a comprehensive study of the subsequent market segments and their leading categories.
By Material – Zirconia Dominates the Market
According to Vasudha, Senior Research Analyst, 6Wresearch, Zirconia holds the leading position in the Qatar 3D Printing Ceramic Market with an estimated share of 46.2% in 2025 and is projected to grow at a CAGR of 11.1% during 2026–2032. Its dominance is spurred by fracture resistance, biocompatibility, and structural stability under cyclic mechanical stress. It is making it the preferred material in dental implants, orthopedic components, and precision engineering parts requiring long-term durability under dynamic loading conditions.
By Application – Aerospace Dominates the Market
Aerospace is predicted to capture the largest Qatar 3D Printing Ceramic Market Share with a 42.8% share in 2025 and is expected to grow at a CAGR of 10.9% during 2026–2032. The segment’s dominance is driven by demand for lightweight, heat-resistant ceramic components used in propulsion systems, thermal shielding units, and high-stress structural assemblies where metal fatigue limitations are a critical design challenge.
Note: Market size and growth projections are calculated using 6Wresearch’s advanced research and forecasting methodology.
Key Attractiveness of the Report
- 10 Years of Market Numbers
- Historical Data Starting from 2022 to 2025
- Base Year: 2025
- Forecast Data until 2032
- Key Performance Indicators Impacting the Market
- Major Upcoming Developments and Projects
Key Highlights of the Report:
- Qatar 3D Printing Ceramic Market Outlook
- Market Size of Qatar 3D Printing Ceramic Market, 2025
- Forecast of Qatar 3D Printing Ceramic Market, 2032
- Historical Data and Forecast of Qatar 3D Printing Ceramic Revenues & Volume for the Period 2022-2032
- Qatar 3D Printing Ceramic Market Trend Evolution
- Qatar 3D Printing Ceramic Market Drivers and Challenges
- Qatar 3D Printing Ceramic Price Trends
- Qatar 3D Printing Ceramic Porter's Five Forces
- Qatar 3D Printing Ceramic Industry Life Cycle
- Historical Data and Forecast of Qatar 3D Printing Ceramic Market Revenues & Volume By Material for the Period 2022-2032
- Historical Data and Forecast of Qatar 3D Printing Ceramic Market Revenues & Volume By Alumina for the Period 2022-2032
- Historical Data and Forecast of Qatar 3D Printing Ceramic Market Revenues & Volume By Zirconia for the Period 2022-2032
- Historical Data and Forecast of Qatar 3D Printing Ceramic Market Revenues & Volume By Silica for the Period 2022-2032
- Historical Data and Forecast of Qatar 3D Printing Ceramic Market Revenues & Volume By Application for the Period 2022-2032
- Historical Data and Forecast of Qatar 3D Printing Ceramic Market Revenues & Volume By Aerospace for the Period 2022-2032
- Historical Data and Forecast of Qatar 3D Printing Ceramic Market Revenues & Volume By Medical Devices for the Period 2022-2032
- Historical Data and Forecast of Qatar 3D Printing Ceramic Market Revenues & Volume By Electronics for the Period 2022-2032
- Qatar 3D Printing Ceramic Import Export Trade Statistics
- Market Opportunity Assessment By Material
- Market Opportunity Assessment By Application
- Qatar 3D Printing Ceramic Top Companies Market Share
- Qatar 3D Printing Ceramic Competitive Benchmarking By Technical and Operational Parameters
- Qatar 3D Printing Ceramic Company Profiles
- Qatar 3D Printing Ceramic Key Strategic Recommendations
Market Covered
The report subsequently covers the market by the following segments and subsegments:
By Material
- Alumina
- Zirconia
- Silica
By Application
- Aerospace
- Medical Devices
- Electronics
Qatar 3D Printing Ceramic Market (2026-2032): FAQs
The Qatar 3D Printing Ceramic Market is projected to grow at a CAGR of 10.6% during 2026–2032.
The Qatar 3D Printing Ceramic Market is primarily driven by the transition toward performance-centric material engineering.
Key constraints include the multi-stage nature of ceramic additive manufacturing, where printing and debinding.
Robust investment potential exists in high-purity ceramic powder development, particularly zirconia formulations personalised for additive manufacturing.
6Wresearch actively monitors the Qatar 3D Printing Ceramic Market and publishes its comprehensive annual report, highlighting emerging trends, growth drivers, revenue analysis, and forecast outlook. Our insights help businesses to make data-backed strategic decisions with ongoing market dynamics. Our analysts track relevent industries related to the Qatar 3D Printing Ceramic Market, allowing our clients with actionable intelligence and reliable forecasts tailored to emerging regional needs.
Yes, we provide customisation as per your requirements. To learn more, feel free to contact us on sales@6wresearch.com
| 1 Executive Summary |
| 2 Introduction |
| 2.1 Key Highlights of the Report |
| 2.2 Report Description |
| 2.3 Market Scope & Segmentation |
| 2.4 Research Methodology |
| 2.5 Assumptions |
| 3 Qatar 3D Printing Ceramic Market Overview |
| 3.1 Qatar Country Macro Economic Indicators |
| 3.2 Qatar 3D Printing Ceramic Market Revenues & Volume, 2022 & 2032F |
| 3.3 Qatar 3D Printing Ceramic Market - Industry Life Cycle |
| 3.4 Qatar 3D Printing Ceramic Market - Porter's Five Forces |
| 3.5 Qatar 3D Printing Ceramic Market Revenues & Volume Share, By Material, 2022 & 2032F |
| 3.6 Qatar 3D Printing Ceramic Market Revenues & Volume Share, By Application, 2022 & 2032F |
| 4 Qatar 3D Printing Ceramic Market Dynamics |
| 4.1 Impact Analysis |
| 4.2 Market Drivers |
| 4.2.1 Technological advancements in 3D printing technology |
| 4.2.2 Increasing demand for customized and complex ceramic products |
| 4.2.3 Growing adoption of 3D printing in various industries in Qatar |
| 4.3 Market Restraints |
| 4.3.1 High initial setup costs for 3D printing ceramic technology |
| 4.3.2 Limited availability of skilled professionals in 3D ceramic printing |
| 4.3.3 Regulatory challenges and quality control issues in 3D ceramic printing |
| 5 Qatar 3D Printing Ceramic Market Trends |
| 6 Qatar 3D Printing Ceramic Market, By Types |
| 6.1 Qatar 3D Printing Ceramic Market, By Material |
| 6.1.1 Overview and Analysis |
| 6.1.2 Qatar 3D Printing Ceramic Market Revenues & Volume, By Material, 2022 - 2032F |
| 6.1.3 Qatar 3D Printing Ceramic Market Revenues & Volume, By Alumina, 2022 - 2032F |
| 6.1.4 Qatar 3D Printing Ceramic Market Revenues & Volume, By Zirconia, 2022 - 2032F |
| 6.1.5 Qatar 3D Printing Ceramic Market Revenues & Volume, By Silica, 2022 - 2032F |
| 6.2 Qatar 3D Printing Ceramic Market, By Application |
| 6.2.1 Overview and Analysis |
| 6.2.2 Qatar 3D Printing Ceramic Market Revenues & Volume, By Aerospace, 2022 - 2032F |
| 6.2.3 Qatar 3D Printing Ceramic Market Revenues & Volume, By Medical Devices, 2022 - 2032F |
| 6.2.4 Qatar 3D Printing Ceramic Market Revenues & Volume, By Electronics, 2022 - 2032F |
| 7 Qatar 3D Printing Ceramic Market Import-Export Trade Statistics |
| 7.1 Qatar 3D Printing Ceramic Market Export to Major Countries |
| 7.2 Qatar 3D Printing Ceramic Market Imports from Major Countries |
| 8 Qatar 3D Printing Ceramic Market Key Performance Indicators |
| 8.1 Rate of adoption of 3D ceramic printing technology in different industries in Qatar |
| 8.2 Number of research and development collaborations in the field of 3D ceramic printing |
| 8.3 Percentage increase in the use of sustainable materials in 3D ceramic printing in Qatar |
| 9 Qatar 3D Printing Ceramic Market - Opportunity Assessment |
| 9.1 Qatar 3D Printing Ceramic Market Opportunity Assessment, By Material, 2022 & 2032F |
| 9.2 Qatar 3D Printing Ceramic Market Opportunity Assessment, By Application, 2022 & 2032F |
| 10 Qatar 3D Printing Ceramic Market - Competitive Landscape |
| 10.1 Qatar 3D Printing Ceramic Market Revenue Share, By Companies, 2025 |
| 10.2 Qatar 3D Printing Ceramic Market Competitive Benchmarking, By Operating and Technical Parameters |
| 11 Company Profiles |
| 12 Recommendations |
| 13 Disclaimer |
Global Go To Market Strategy - 2030
Export potential enables firms to identify high-growth global markets with greater confidence by combining advanced trade intelligence with a structured quantitative methodology. The framework analyzes emerging demand trends and country-level import patterns while integrating macroeconomic and trade datasets such as GDP and population forecasts, bilateral import–export flows, tariff structures, elasticity differentials between developed and developing economies, geographic distance, and import demand projections. Using weighted trade values from 2020–2024 as the base period to project country-to-country export potential for 2030, these inputs are operationalized through calculated drivers such as gravity model parameters, tariff impact factors, and projected GDP per-capita growth. Through an analysis of hidden potentials, demand hotspots, and market conditions that are most favorable to success, this method enables firms to focus on target countries, maximize returns, and global expansion with data, backed by accuracy.
By factoring in the projected importer demand gap that is currently unmet and could be potential opportunity, it identifies the potential for the Exporter (Country) among 190 countries, against the general trade analysis, which identifies the biggest importer or exporter.
To discover high-growth global markets and optimize your business strategy:
Click Here
Pricing
- Single User License$ 1,995
- Department License$ 2,400
- Site License$ 3,120
- Global License$ 3,795

Leadership Perspectives from Industry Events
Search
Thought Leadership and Analyst Meet


Our Clients
6WResearch In News
- Doha a strategic location for EV manufacturing hub: IPA Qatar
- Demand for luxury TVs surging in the GCC, says Samsung
- Empowering Growth: The Thriving Journey of Bangladesh’s Cable Industry
- Demand for luxury TVs surging in the GCC, says Samsung
- Video call with a traditional healer? Once unthinkable, it’s now common in South Africa
- Intelligent Buildings To Smooth GCC’s Path To Net Zero
Latest Reports
- Cape Verde Portable Hand-Thrown Extinguisher Market (2026-2032)
- Canada Portable Hand-Thrown Extinguisher Market (2026-2032)
- Cameroon Portable Hand-Thrown Extinguisher Market (2026-2032)
- Burundi Portable Hand-Thrown Extinguisher Market (2026-2032)
- Burkina Faso Portable Hand-Thrown Extinguisher Market (2026-2032)
- Bulgaria Portable Hand-Thrown Extinguisher Market (2026-2032)
- Brunei Portable Hand-Thrown Extinguisher Market (2026-2032)
- Botswana Portable Hand-Thrown Extinguisher Market (2026-2032)
- Bosnia and Herzegovina Portable Hand-Thrown Extinguisher Market (2026-2032)
- Bolivia Portable Hand-Thrown Extinguisher Market (2026-2032)
Industry Events and Analyst Meet

HIMTEX 2026

India Refining Summit 2026

India EV Show 2026

EV tech India Expo 2026

Auto Tech Asia 2026
Whitepaper
- Middle East & Africa Commercial Security Market Click here to view more.
- Middle East & Africa Fire Safety Systems & Equipment Market Click here to view more.
- GCC Drone Market Click here to view more.
- Middle East Lighting Fixture Market Click here to view more.
- GCC Physical & Perimeter Security Market Click here to view more.