Qatar Interactive Tables Market (2026-2032) Outlook | Value, Forecast, Trends, Size, Analysis, Revenue, Share, Growth, Companies & Industry
Market Forecast By Technology (LCD, LED, Capacitive, Others), By Screen Size (32-65 Inch, 65 Inch & Above), By Application (Exhibition & Trade Shows, Education, Retail, Control Room, Hospitality, Transportation, Others) And Competitive Landscape
| Product Code: ETC275081 | Publication Date: Aug 2022 | Updated Date: Jul 2026 | Product Type: Market Research Report | |
| Publisher: 6Wresearch | Author: Ravi Bhandari | No. of Pages: 75 | No. of Figures: 35 | No. of Tables: 20 |
Qatar Interactive Tables Market Size, Share & Growth Rate
The Qatar Interactive Tables Market was estimated at USD 467 Million in 2025 and is projected to reach USD 627 Million by 2032, growing at a CAGR of 4.3% from 2026 to 2032. This trajectory is primarily fueled by the rapid integration of technology in educational and corporate sectors, reflecting Qatar's vision for modernization. With institutions embracing interactive learning methodologies, and businesses seeking enhanced collaborative tools, the demand for innovative solutions is set to escalate significantly.
Qatar Interactive Tables Market Year-wise Growth Rate and Key Drivers
This graph highlights how the Qatar Interactive Tables Market has steadily grown over the years, supported by major growth factors.
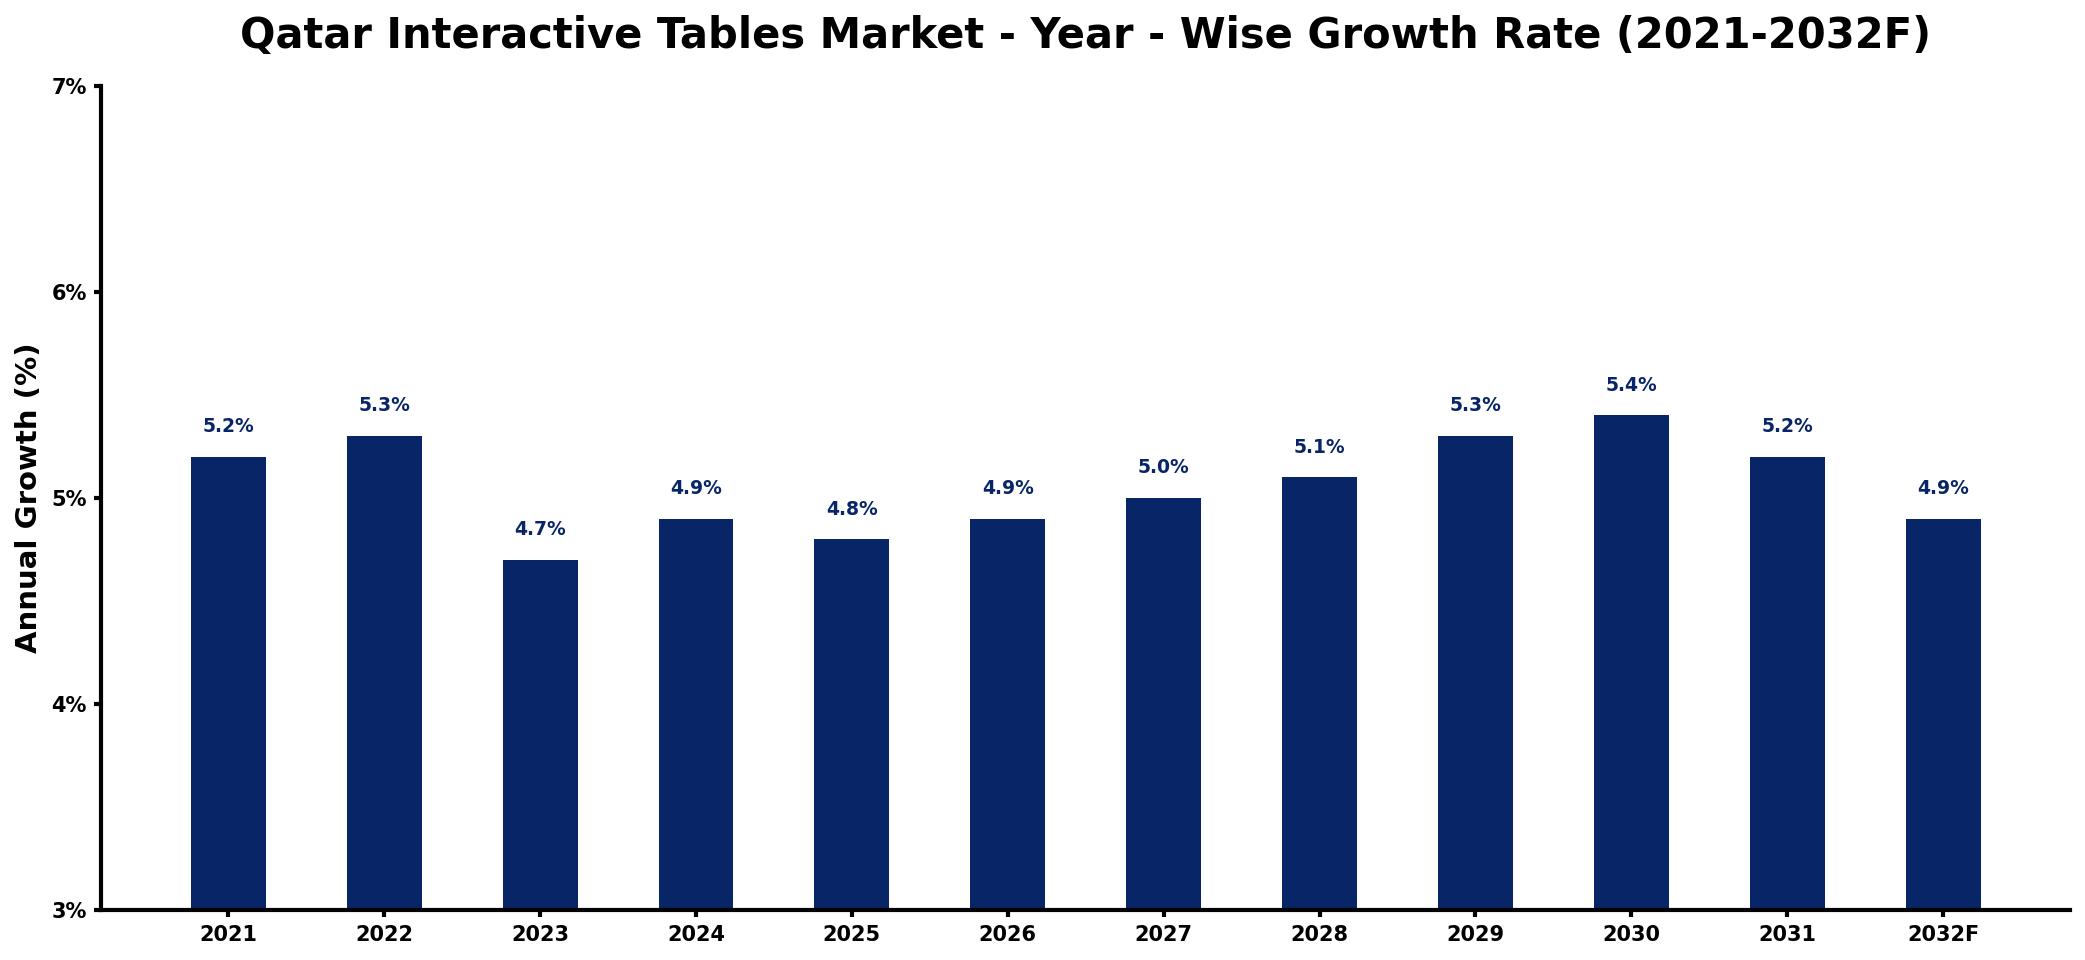
The table below presents the year‑wise growth rates along with the key drivers influencing the market
| Year | Growth Rate | Major Drivers |
| 2021 | 5.2% | Rising demand for digital solutions |
| 2022 | 5.3% | Increased investment in technology |
| 2023 | 4.7% | Growing interest in immersive experiences |
| 2024 | 4.9% | Expansion of entertainment venues |
| 2025 | 4.8% | Surge in educational technology adoption |
| 2026 | 4.9% | Development of smart city initiatives |
| 2027 | 5.0% | Boost in hospitality sector applications |
| 2028 | 5.1% | Enhanced consumer engagement strategies |
| 2029 | 5.3% | Growth in corporate training programs |
| 2030 | 5.4% | Increase in event management services |
| 2031 | 5.2% | Strengthening of retail customer interactions |
| 2032 | 4.9% | Advancements in user interface design |
Note: Market size estimations and growth projections presented in this report are based on 6Wresearch's proprietary forecasting methodology, utilizing the latest available industry data, government publications, and primary research inputs.
Qatar Interactive Tables Market Synopsis
In recent years, interactive tables have surged in popularity across Qatar, especially within educational and corporate environments. This rise is largely attributed to a national commitment to enhancing technological infrastructure, facilitating interactive learning experiences, and fostering collaboration in business settings.
As Qatar positions itself at the forefront of technological advancement, the interactive tables market is becoming increasingly vital. Educational institutions are adopting these tables to engage students and improve outcomes, while businesses are leveraging their capabilities for presentations and team collaborations, marking a significant shift towards digitalization.
Qatar Interactive Tables Market Key Takeaways
- The market is witnessing robust growth due to increased adoption of educational technologies in schools and universities.
- Corporate sectors are prioritizing interactive solutions for improved teamwork and productivity.
- Continuous advancements in technology are essential for manufacturers to remain competitive.
- The post-COVID-19 environment is driving a renewed focus on hybrid learning and collaborative workspaces.
- Government initiatives aimed at digital transformation are further bolstering market prospects.
Evaluation of Restraints in Qatar Interactive Tables Market
Despite the promising outlook for the Qatar interactive tables market, manufacturers face several constraints. The necessity for continual technological updates poses a challenge for sustaining competitiveness, as customer expectations evolve rapidly. Additionally, ensuring the durability and reliability of these products is critical, given their extensive use in various environments. Adapting to shifting educational and business trends, along with regulatory changes, also requires agility from manufacturers to address market demands effectively.
Qatar Interactive Tables Market Trends
Several trends are shaping the Qatar interactive tables market landscape. The rise of hybrid learning environments, combining both in-person and remote education, is significantly influencing product design and functionality. Furthermore, increasing recognition of the importance of collaboration in corporate settings is driving demand for versatile interactive tables that support teamwork. Theres also a growing emphasis on integrating smart technologies, such as AI and IoT, into interactive tables to enhance user engagement and functionality.
Qatar Interactive Tables Market Opportunities
Opportunities abound in the Qatar interactive tables market as educational and corporate institutions seek to innovate. The potential for developing customized interactive solutions tailored to specific learning or business needs presents a lucrative avenue for growth. Additionally, as businesses and schools increasingly prioritize sustainability, manufacturers who focus on eco-friendly materials and energy-efficient technologies may capture a competitive edge. The evolving landscape of remote work also calls for solutions that facilitate seamless connectivity, creating further investment opportunities.
Government Initiatives in the Qatar Interactive Tables Market
The Qatari government is actively investing in digital transformation across sectors, which includes enhancing the technology ecosystem in education and business. Programs that support the integration of advanced technologies in classrooms and workplaces are being prioritized, fostering an environment conducive to the growth of the interactive tables market. Additionally, public spending aimed at infrastructural improvements, coupled with incentives for tech innovation, is set to boost market potential significantly.
Future Insights of the Qatar Interactive Tables Market
Looking ahead to 2026-2032, the Qatar interactive tables market is expected to thrive as the demand for interactive and collaborative solutions expands. The ongoing commitment to education reform and digitalization will continue to fuel market growth, with technology becoming increasingly integrated into everyday learning and working environments. As manufacturers respond to evolving consumer needs, innovative features are likely to emerge, further enhancing the appeal of interactive tables across various sectors.
Qatar Interactive Tables Market Latest Developments (2025 - 2026)
Recent trends in the Qatar interactive tables market indicate a strong shift toward hybrid solutions that facilitate both in-person and remote interactions. Companies are focusing on incorporating advanced technologies to make their products more user-friendly and adaptive to modern educational and corporate needs. Additionally, partnerships between educational institutions and technology providers are becoming more common as they seek to enhance the learning experience through innovative interactive tools.
Qatar Interactive Tables Market - Key Attractiveness of the Report
- 10 Years of Market Numbers
- Historical Data Starting from 2022 to 2025
- Base Year: 2025
- Forecast Data until 2032
- Key Performance Indicators Impacting the Market
- Major Upcoming Developments and Projects
Key Highlights of the Report:
- Qatar Interactive Tables Market Outlook
- Market Size of Qatar Interactive Tables Market, 2025
- Forecast of Qatar Interactive Tables Market, 2032
- Historical Data and Forecast of Qatar Interactive Tables Revenues & Volume for the Period 2022-2032F
- Qatar Interactive Tables Market Trend Evolution
- Qatar Interactive Tables Market Drivers and Challenges
- Qatar Interactive Tables Price Trends
- Qatar Interactive Tables Porter's Five Forces
- Qatar Interactive Tables Industry Life Cycle
- Historical Data and Forecast of Qatar Interactive Tables Market Revenues & Volume By Technology for the Period 2022-2032F
- Historical Data and Forecast of Qatar Interactive Tables Market Revenues & Volume By LCD for the Period 2022-2032F
- Historical Data and Forecast of Qatar Interactive Tables Market Revenues & Volume By LED for the Period 2022-2032F
- Historical Data and Forecast of Qatar Interactive Tables Market Revenues & Volume By Capacitive for the Period 2022-2032F
- Historical Data and Forecast of Qatar Interactive Tables Market Revenues & Volume By Others for the Period 2022-2032F
- Historical Data and Forecast of Qatar Interactive Tables Market Revenues & Volume By Screen Size for the Period 2022-2032F
- Historical Data and Forecast of Qatar Interactive Tables Market Revenues & Volume By 32-65 Inch for the Period 2022-2032F
- Historical Data and Forecast of Qatar Interactive Tables Market Revenues & Volume By 65 Inch & Above for the Period 2022-2032F
- Historical Data and Forecast of Qatar Interactive Tables Market Revenues & Volume By Application for the Period 2022-2032F
- Historical Data and Forecast of Qatar Interactive Tables Market Revenues & Volume By Exhibition & Trade Shows for the Period 2022-2032F
- Historical Data and Forecast of Qatar Interactive Tables Market Revenues & Volume By Education for the Period 2022-2032F
- Historical Data and Forecast of Qatar Interactive Tables Market Revenues & Volume By Retail for the Period 2022-2032F
- Historical Data and Forecast of Qatar Interactive Tables Market Revenues & Volume By Control Room for the Period 2022-2032F
- Historical Data and Forecast of Qatar Interactive Tables Market Revenues & Volume By Hospitality for the Period 2022-2032F
- Historical Data and Forecast of Qatar Interactive Tables Market Revenues & Volume By Transportation for the Period 2022-2032F
- Historical Data and Forecast of Qatar Interactive Tables Market Revenues & Volume By Others for the Period 2022-2032F
- Qatar Interactive Tables Import Export Trade Statistics
- Market Opportunity Assessment By Technology
- Market Opportunity Assessment By Screen Size
- Market Opportunity Assessment By Application
- Qatar Interactive Tables Top Companies Market Share
- Qatar Interactive Tables Competitive Benchmarking By Technical and Operational Parameters
- Qatar Interactive Tables Company Profiles
- Qatar Interactive Tables Key Strategic Recommendations
Frequently Asked Questions About the Market Study (FAQs):
Initially, the demand for interactive tables decreased due to restrictions on gatherings and the shift to remote learning. However, the market is recovering as educational and corporate sectors adapt to hybrid models that utilize these tables.
The Qatar Interactive Tables Market is projected to reach USD 627 Million by 2032, up from USD 467 Million in 2025, growing at a CAGR of 4.3% between 2026 and 2032.
The largest users of interactive tables in Qatar are primarily educational institutions and corporate environments, both of which are increasingly prioritizing technological integration for enhanced engagement and collaboration.
Key trends include the rise of hybrid learning models, increased collaboration in corporate settings, and the incorporation of smart technologies to enhance user interaction and engagement.
Manufacturers face challenges related to the need for constant technological updates, ensuring product reliability, and adapting to evolving educational and business trends and regulations.
6Wresearch actively monitors the Qatar Interactive Tables Market and publishes its comprehensive annual report, highlighting emerging trends, growth drivers, revenue analysis, and forecast outlook. Our insights help businesses to make data-backed strategic decisions with ongoing market dynamics. Our analysts track relevent industries related to the Qatar Interactive Tables Market, allowing our clients with actionable intelligence and reliable forecasts tailored to emerging regional needs.
Yes, we provide customisation as per your requirements. To learn more, feel free to contact us on sales@6wresearch.com
1 Executive Summary |
2 Introduction |
2.1 Key Highlights of the Report |
2.2 Report Description |
2.3 Market Scope & Segmentation |
2.4 Research Methodology |
2.5 Assumptions |
3 Qatar Interactive Tables Market Overview |
3.1 Qatar Country Macro Economic Indicators |
3.2 Qatar Interactive Tables Market Revenues & Volume, 2022 & 2032F |
3.3 Qatar Interactive Tables Market - Industry Life Cycle |
3.4 Qatar Interactive Tables Market - Porter's Five Forces |
3.5 Qatar Interactive Tables Market Revenues & Volume Share, By Technology, 2022 & 2032F |
3.6 Qatar Interactive Tables Market Revenues & Volume Share, By Screen Size, 2022 & 2032F |
3.7 Qatar Interactive Tables Market Revenues & Volume Share, By Application, 2022 & 2032F |
4 Qatar Interactive Tables Market Dynamics |
4.1 Impact Analysis |
4.2 Market Drivers |
4.2.1 Increasing demand for interactive and engaging technologies in educational institutions and corporate sectors in Qatar |
4.2.2 Growing investment in smart infrastructure and digital transformation initiatives by the Qatari government |
4.2.3 Rising adoption of interactive tables in retail outlets, restaurants, and entertainment venues to enhance customer experience and engagement |
4.3 Market Restraints |
4.3.1 High initial investment and maintenance costs associated with interactive tables |
4.3.2 Limited awareness and understanding of the benefits of interactive tables among potential end-users in Qatar |
4.3.3 Lack of skilled professionals to provide technical support and maintenance services for interactive tables |
5 Qatar Interactive Tables Market Trends |
6 Qatar Interactive Tables Market, By Types |
6.1 Qatar Interactive Tables Market, By Technology |
6.1.1 Overview and Analysis |
6.1.2 Qatar Interactive Tables Market Revenues & Volume, By Technology, 2022-2032F |
6.1.3 Qatar Interactive Tables Market Revenues & Volume, By LCD, 2022-2032F |
6.1.4 Qatar Interactive Tables Market Revenues & Volume, By LED, 2022-2032F |
6.1.5 Qatar Interactive Tables Market Revenues & Volume, By Capacitive, 2022-2032F |
6.1.6 Qatar Interactive Tables Market Revenues & Volume, By Others, 2022-2032F |
6.2 Qatar Interactive Tables Market, By Screen Size |
6.2.1 Overview and Analysis |
6.2.2 Qatar Interactive Tables Market Revenues & Volume, By 32-65 Inch, 2022-2032F |
6.2.3 Qatar Interactive Tables Market Revenues & Volume, By 65 Inch & Above, 2022-2032F |
6.3 Qatar Interactive Tables Market, By Application |
6.3.1 Overview and Analysis |
6.3.2 Qatar Interactive Tables Market Revenues & Volume, By Exhibition & Trade Shows, 2022-2032F |
6.3.3 Qatar Interactive Tables Market Revenues & Volume, By Education, 2022-2032F |
6.3.4 Qatar Interactive Tables Market Revenues & Volume, By Retail, 2022-2032F |
6.3.5 Qatar Interactive Tables Market Revenues & Volume, By Control Room, 2022-2032F |
6.3.6 Qatar Interactive Tables Market Revenues & Volume, By Hospitality, 2022-2032F |
6.3.7 Qatar Interactive Tables Market Revenues & Volume, By Transportation, 2022-2032F |
7 Qatar Interactive Tables Market Import-Export Trade Statistics |
7.1 Qatar Interactive Tables Market Export to Major Countries |
7.2 Qatar Interactive Tables Market Imports from Major Countries |
8 Qatar Interactive Tables Market Key Performance Indicators |
8.1 Average daily usage time of interactive tables in educational institutions, corporate offices, and commercial establishments |
8.2 Percentage of increase in the adoption rate of interactive tables across different industries in Qatar |
8.3 Number of interactive table installations in new smart infrastructure projects in Qatar |
9 Qatar Interactive Tables Market - Opportunity Assessment |
9.1 Qatar Interactive Tables Market Opportunity Assessment, By Technology, 2022 & 2032F |
9.2 Qatar Interactive Tables Market Opportunity Assessment, By Screen Size, 2022 & 2032F |
9.3 Qatar Interactive Tables Market Opportunity Assessment, By Application, 2022 & 2032F |
10 Qatar Interactive Tables Market - Competitive Landscape |
10.1 Qatar Interactive Tables Market Revenue Share, By Companies, 2025 |
10.2 Qatar Interactive Tables Market Competitive Benchmarking, By Operating and Technical Parameters |
11 Company Profiles |
12 Recommendations |
13 Disclaimer |
Global Go To Market Strategy - 2030
Export potential enables firms to identify high-growth global markets with greater confidence by combining advanced trade intelligence with a structured quantitative methodology. The framework analyzes emerging demand trends and country-level import patterns while integrating macroeconomic and trade datasets such as GDP and population forecasts, bilateral import–export flows, tariff structures, elasticity differentials between developed and developing economies, geographic distance, and import demand projections. Using weighted trade values from 2020–2024 as the base period to project country-to-country export potential for 2030, these inputs are operationalized through calculated drivers such as gravity model parameters, tariff impact factors, and projected GDP per-capita growth. Through an analysis of hidden potentials, demand hotspots, and market conditions that are most favorable to success, this method enables firms to focus on target countries, maximize returns, and global expansion with data, backed by accuracy.
By factoring in the projected importer demand gap that is currently unmet and could be potential opportunity, it identifies the potential for the Exporter (Country) among 190 countries, against the general trade analysis, which identifies the biggest importer or exporter.
To discover high-growth global markets and optimize your business strategy:
Click Here
Pricing
- Single User License$ 1,995
- Department License$ 2,400
- Site License$ 3,120
- Global License$ 3,795

Leadership Perspectives from Industry Events
Search
Thought Leadership and Analyst Meet


Our Clients
6WResearch In News
- India Air Conditioner Market Set for Strong Rebound in 2026 After Weather-Led Correction and GST-Driven Recovery: 6Wresearch
- ADAS in India: How Automatic Emergency Braking, Blind Spot Detection & Driver Monitoring are Transforming Road Safety
- Doha a strategic location for EV manufacturing hub: IPA Qatar
- Demand for luxury TVs surging in the GCC, says Samsung
- Empowering Growth: The Thriving Journey of Bangladesh’s Cable Industry
- Demand for luxury TVs surging in the GCC, says Samsung
Latest Reports
- Nicaragua RPG Gaming Market (2026-2032)
- New Zealand RPG Gaming Market (2026-2032)
- Netherlands RPG Gaming Market (2026-2032)
- Nauru RPG Gaming Market (2026-2032)
- Namibia RPG Gaming Market (2026-2032)
- Mozambique RPG Gaming Market (2026-2032)
- Montenegro RPG Gaming Market (2026-2032)
- Mongolia RPG Gaming Market (2026-2032)
- Monaco RPG Gaming Market (2026-2032)
- Micronesia RPG Gaming Market (2026-2032)
Industry Events and Analyst Meet

EV India Expo 2026

HIMTEX 2026

India Refining Summit 2026

India EV Show 2026

EV tech India Expo 2026
Whitepaper
- Middle East & Africa Commercial Security Market Click here to view more.
- Middle East & Africa Fire Safety Systems & Equipment Market Click here to view more.
- GCC Drone Market Click here to view more.
- Middle East Lighting Fixture Market Click here to view more.
- GCC Physical & Perimeter Security Market Click here to view more.