Romania 3D Ics Market (2026-2032) | Demand, Share, Industry, Strategy, Segmentation, Investment Trends, Restraints, Outlook, Competition, Size, Segments, Competitive, Growth, Challenges, Analysis, Revenue, Consumer Insights, Opportunities, Pricing Analysis, Drivers, Trends, Companies, Forecast, Value, Strategic Insights, Supply
Market Forecast By Technology (Through-Silicon Via, Package-on-Package), By Application (Memory, Imaging, Networking), By Manufacturing Process (Stacked, Monolithic), By End user (Automotive, Consumer Electronics) And Competitive Landscape
| Product Code: ETC11486500 | Publication Date: Apr 2025 | Updated Date: May 2026 | Product Type: Market Research Report | |
| Publisher: 6Wresearch | Author: Bhawna Singh | No. of Pages: 65 | No. of Figures: 34 | No. of Tables: 19 |
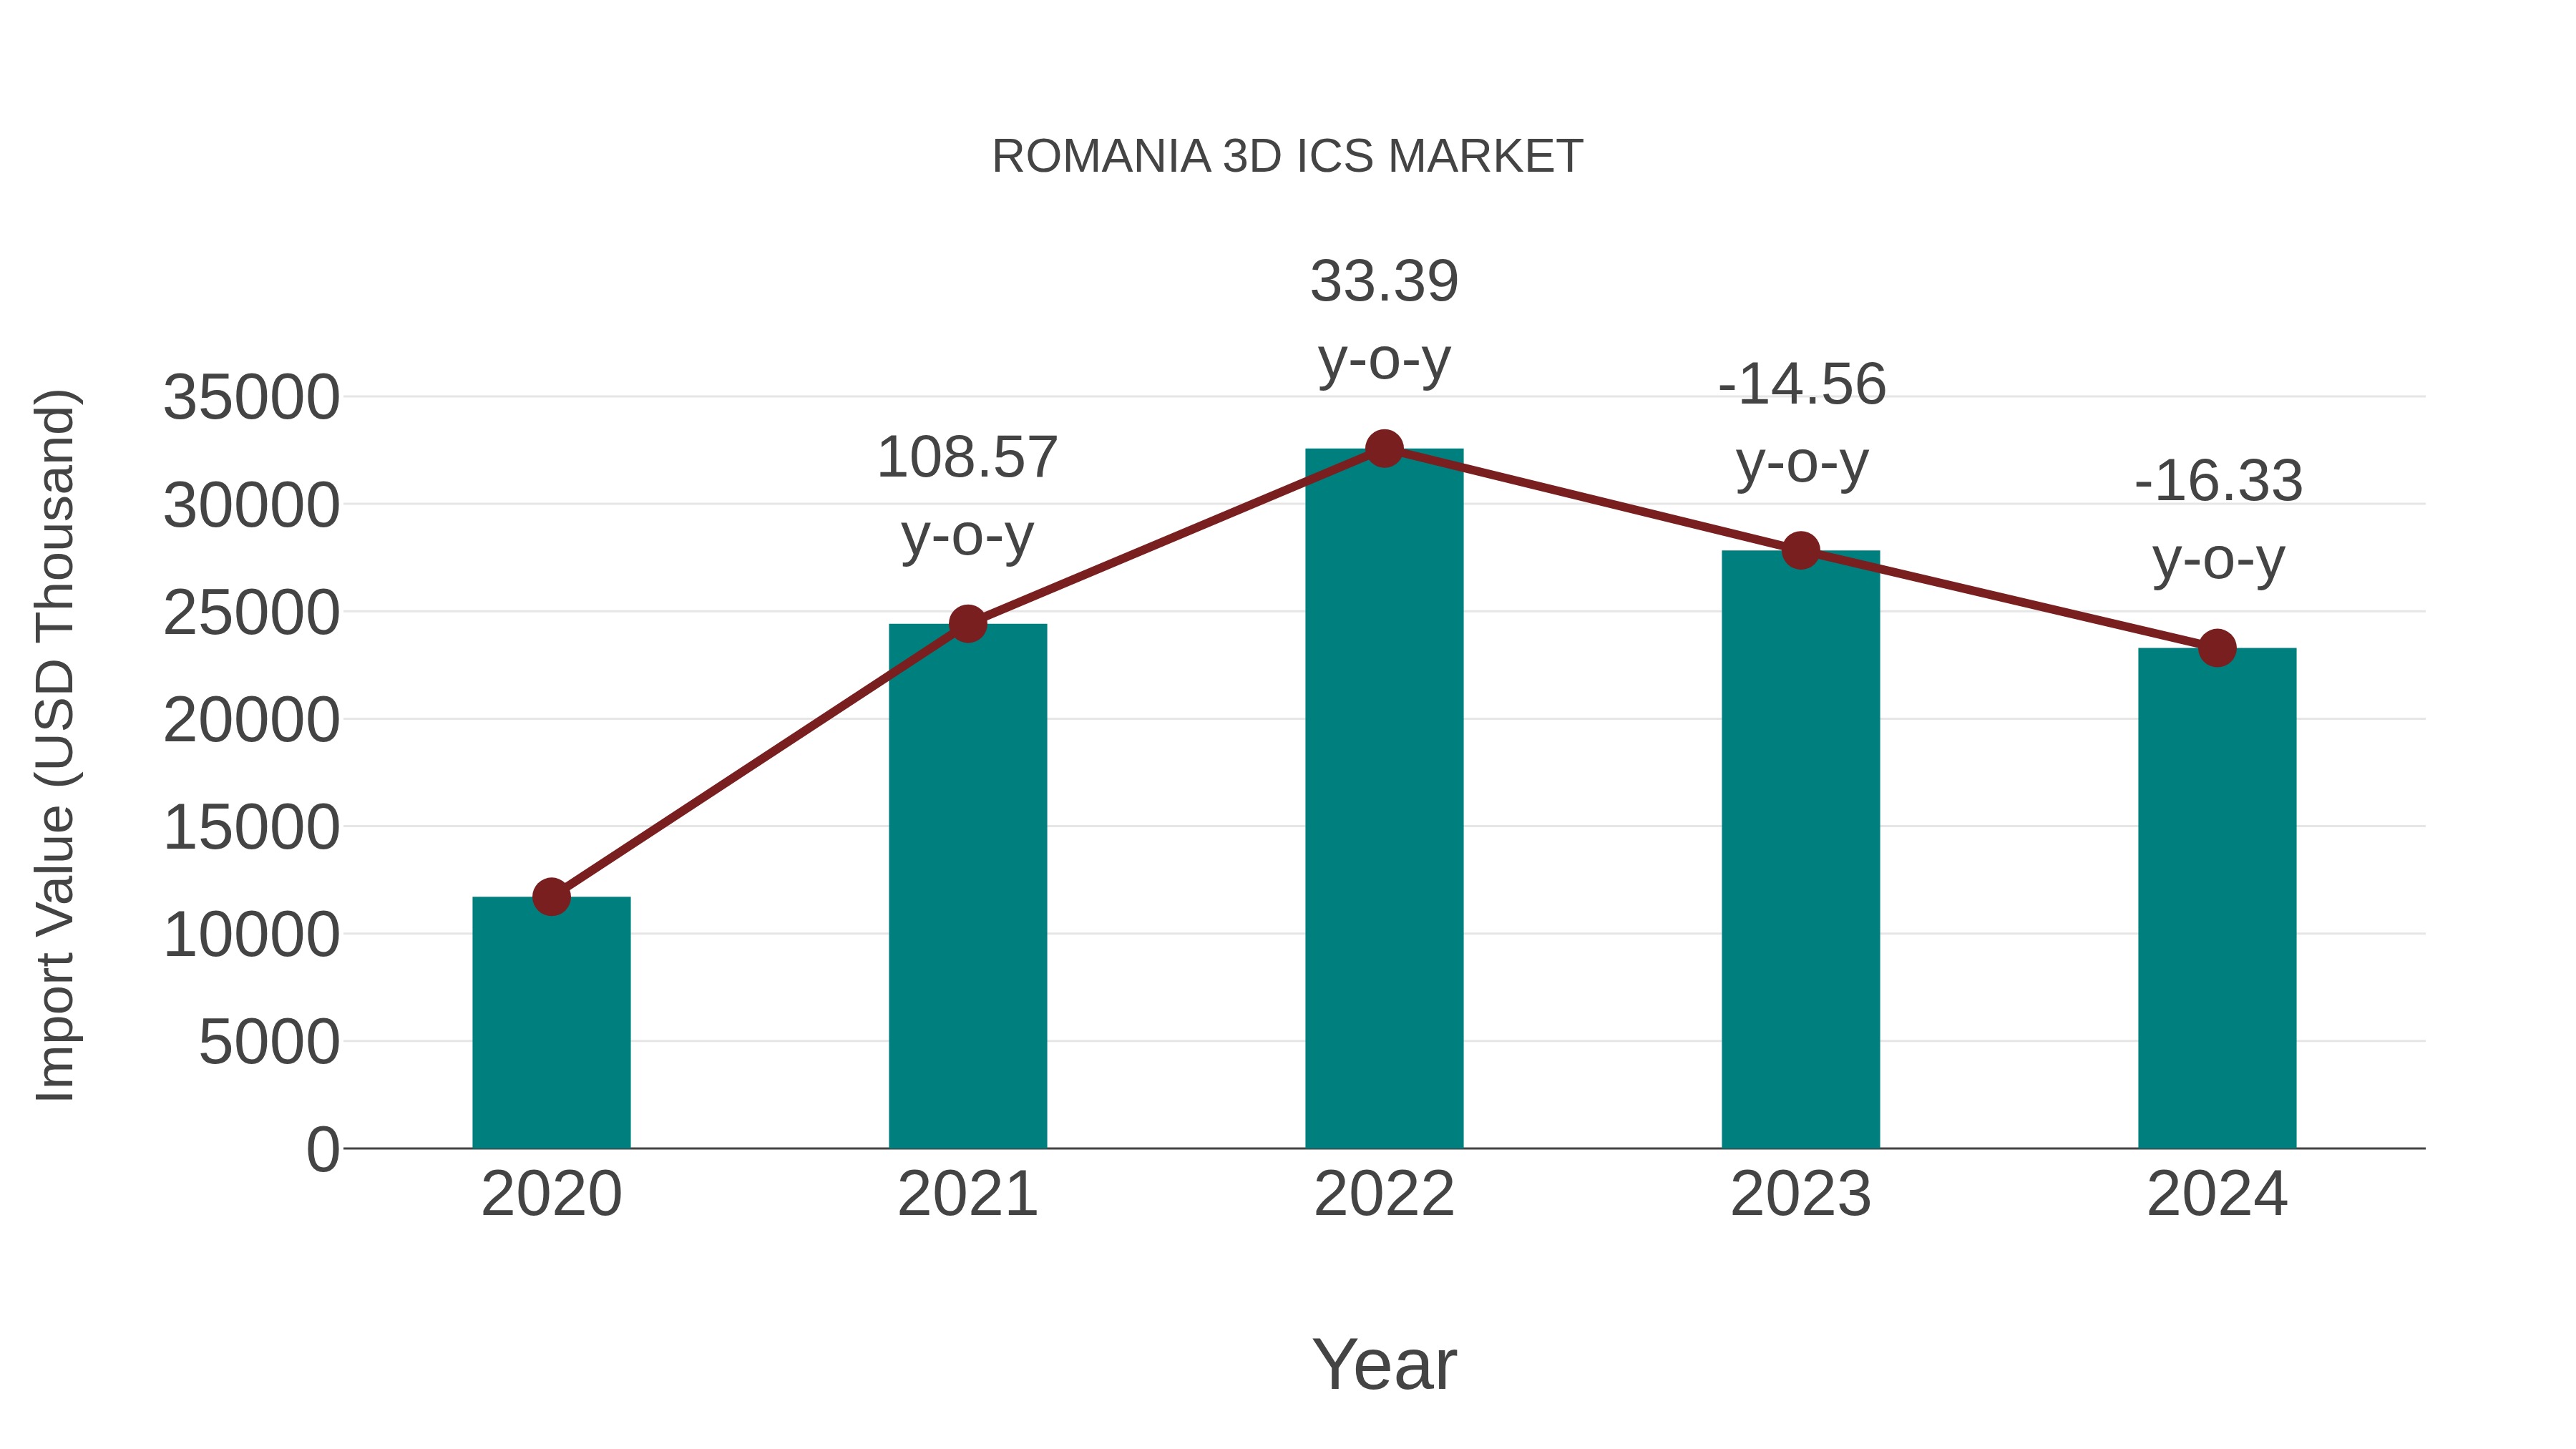
Romania 3d Ics Market: Import Trend Analysis
In the Romania 3D ICs market, the import trend exhibited a decline from 2023 to 2024, with a growth rate of -16.33%. However, the compound annual growth rate (CAGR) for the period 2020-2024 stood at 18.76%. This decline in import momentum could be attributed to shifts in demand dynamics or alterations in trade policies within the market.
Romania 3D ICs Market Growth Rate
According to 6Wresearch internal database and industry insights, the Romania 3D ICs Market is projected to grow at a compound annual growth rate (CAGR) of 10.1% during the forecast period (2026-2032).
Topics Covered in the Romania 3D ICs Market Report
The Romania 3D ICs Market report thoroughly covers the market by technology, application, manufacturing process, and end user. The market report provides an unbiased and detailed analysis of ongoing market trends, opportunities/high growth areas, and market drivers, which help stakeholders devise and align their market strategies according to the current and future market dynamics.
Romania 3D ICs Market Highlights
| Report Name | Romania 3D ICs Market |
| Forecast period | 2026-2032 |
| CAGR | 10.1% |
| Growing Sector | Consumer Electronics |
Romania 3D ICs Market Synopsis
Romania 3D ICs Market is anticipated to witness substantial growth due to the rising requirement of fast semiconductor devices, rising application of artificial intelligence technologies, and growing adoption of miniaturized electronics across various industries. With the help of 3D IC Technology, several ICs can be stacked one above another, hence making them operate faster, saving energy, and increasing efficiency. Moreover, increased investment in automotive electronics, smart devices, and communication infrastructure is creating favorable market conditions. Increased focus on semiconductors technology and Romania’s participation in the digital transformation activities of Europe are adding further momentum to market growth during the forecast period.
Evaluation of Growth Drivers in the Romania 3D ICs Market (2026-2032)
Below mentioned are some prominent drivers and their influence on the market dynamics:
| Drivers | Primary Segments Affected | Why it Matters (Evidence) |
| Growing Demand for High-Performance Computing | Through-Silicon Via; Memory | Advanced processors require compact and faster semiconductor architectures. |
| Expansion of Consumer Electronics Manufacturing | Package-on-Package; Consumer Electronics | Smartphones and wearable devices increase demand for efficient chip stacking technologies. |
| Increasing Automotive Semiconductor Usage | Through-Silicon Via; Automotive | Electric vehicles and ADAS systems require advanced integrated circuit performance. |
| Rising AI and IoT Integration | Stacked; Networking | AI-enabled devices depend on high-density and low-power semiconductor solutions. |
| Government Support for Digital Infrastructure | All Types; Consumer Electronics & Automotive | National digitalization initiatives encourage semiconductor technology investments. |
Romania 3D ICs Market is expected to grow at the CAGR of 10.1% during the forecast period of 2026-2032. Market growth will be facilitated by the increased use of semiconductor technology in consumer electronics, automobiles, and networking solutions. The trend of using artificial intelligence, cloud computing, and Internet of Things devices is becoming more prevalent and necessitates smaller and faster semiconductor integrated circuits. Moreover, increased investments in advanced computing and smart manufacturing technologies have triggered innovations in semiconductor architecture. The role of Romania in the development of semiconductors in Europe and its emphasis on electronic manufacturing may also help to spur growth in the market.
Evaluation of Restraints in the Romania 3D ICs Market
Below mentioned are some major restraints and their influence on the market dynamics:
| Restraints | Primary Segments Affected | What This Means (Evidence) |
| High Manufacturing Costs | Through-Silicon Via; Automotive | Advanced fabrication technologies require significant capital investment. |
| Complex Chip Integration Processes | Stacked; Networking | Multi-layer chip assembly increases production and testing complexities. |
| Limited Skilled Workforce | All Types; Consumer Electronics | Shortage of semiconductor specialists slows innovation and expansion. |
| Dependence on Imported Semiconductor Components | Package-on-Package; Memory | Supply chain disruptions affect manufacturing consistency and pricing. |
| Thermal Management Issues | Monolithic; Automotive | Heat dissipation challenges impact chip reliability and operational efficiency. |
Romania 3D ICs Industry Challenges
Despite rapid advancements in semiconductor technologies, the Romania 3D ICs Industry continues to face several structural and operational challenges. Among the critical problems that are worth mentioning is the extremely high cost involved in using advanced technology in the production process for making semiconductor chips, thereby limiting the ability of small firms to manufacture their own semiconductors. Besides, the shortage of qualified engineers specializing in semiconductors poses a serious problem in coming up with innovations in production processes. Importing material and machines to manufacture semiconductors can pose serious problems for these organizations since prices change from time to time. There are also challenges associated with thermal management when manufacturing vertical semiconductor chips.
Romania 3D ICs Market Trends
Major trends in the Romania 3D ICs Market Growth include:
- AI Chips Become Commonly Utilized: The advent of chips that are designed for artificial intelligence has led to a greater adoption of 3D ICs.
- More Use of Electronics in Cars: There is a rising requirement for miniature electronics in ADAS and electric cars.
- Increased Utilization of Through-Silicon Via Technique: This technique has grown in popularity due to its greater connectivity.
- Growth in Intelligent Consumer Electronics: Intelligent consumer devices and gadgets like smartwatches and smartphones have boosted the adoption of miniature ICs.
Investment Opportunities in the Romania 3D ICs Market
Emerging investment opportunities in the Romania 3D ICs Market Share include:
- Semiconductor Research and Development Centers – Research and development center investments help improve semiconductor innovation abilities.
- Manufacturing of Electronics in Vehicles – Growing production of electric vehicles offers opportunities in electronics fabrication.
- Manufacturing of Consumer Electronics – Growth in the consumer electronics manufacturing industry drives the need for small semiconductors.
Top 5 Leading Players in the Romania 3D ICs Market
Some leading players operating in the Romania 3D ICs Market include:
1. Intel Corporation
| Company Name | Intel Corporation |
| Established Year | 1968 |
| Headquarters | California, USA |
| Official Website | Click Here |
Intel Corporation develops advanced semiconductor technologies including 3D integrated circuits for high-performance computing, networking, and AI applications. The company focuses on innovative chip architectures that improve speed, energy efficiency, and processing capabilities across consumer electronics and industrial sectors worldwide.
2. Samsung Electronics Co., Ltd.
| Company Name | Samsung Electronics Co., Ltd. |
| Established Year | 1969 |
| Headquarters | Suwon, South Korea |
| Official Website | Click Here |
emory and logic chips using 3D IC technologies for smartphones, AI systems, and automotive electronics. The company continuously invests in semiconductor innovation to improve chip integration, performance optimization, and next-generation electronic device capabilities globally.
3. Taiwan Semiconductor Manufacturing Company (TSMC)
| Company Name | Taiwan Semiconductor Manufacturing Company (TSMC) |
| Established Year | 1987 |
| Headquarters | Hsinchu, Taiwan |
| Official Website | Click Here |
TSMC is a leading semiconductor manufacturer specializing in advanced chip fabrication and 3D integration technologies. The company provides semiconductor solutions for high-performance computing, networking, automotive systems, and AI-enabled devices, supporting global demand for compact and energy-efficient electronics.
4. Micron Technology, Inc.
| Company Name | Micron Technology, Inc. |
| Established Year | 1978 |
| Headquarters | Idaho, USA |
| Official Website | Click Here |
Micron Technology develops advanced memory solutions using innovative 3D IC architectures for data centers, automotive electronics, and consumer devices. The company focuses on improving memory density, data transfer speeds, and energy efficiency to support evolving computing and storage requirements.
5. ASE Technology Holding Co., Ltd.
| Company Name | ASE Technology Holding Co., Ltd. |
| Established Year | 1984 |
| Headquarters | Kaohsiung, Taiwan |
| Official Website | Click Here |
ASE Technology Holding specializes in semiconductor packaging and testing services for advanced 3D integrated circuit technologies. The company supports applications across telecommunications, consumer electronics, automotive systems, and industrial devices through innovative chip integration and packaging solutions.
Government Regulations Introduced in the Romania 3D ICs Market
According to Romania’s government data, various steps have taken to encourage the manufacture of semiconductors and advanced electronics through several different policies. The involvement of Romania in the European Chips Act program has led to an increase in investments in semiconductor research, logistics, and manufacturing processes. The government has also embarked on implementing various programs that will facilitate the process of digitizing industries and smart manufacturing practices. The government is developing various policies, including funding and tax incentives, which will help encourage foreign investment in semiconductor projects and local electronics manufacturing. In addition, partnerships with other research organizations have been effective in improving semiconductor skills training and innovations in integrated circuit designs.
Future Insights of the Romania 3D ICs Market
Romania 3D ICs Market is expected to witness strong long-term growth driven by increasing adoption of advanced semiconductor technologies, expanding AI applications, and rising demand for high-performance electronic devices. This trend is set to contribute to the growth of the market due to the rising investments in the field of automotive electronics, network infrastructure, and consumer electronic technologies that require energy-efficient chips. Furthermore, the participation of Romania in European initiatives in semiconductors, coupled with the increasing emphasis placed on digitalization within the Romanian industry, is likely to result in the strengthening of the semiconductor sector of Romania. Continuous innovations in stacked die architecture, through-silicon vias, and monolithic integration technologies will offer additional opportunities to semiconductor companies.
Market Segmentation Analysis
The report offers a comprehensive study of the subsequent market segments and their leading categories.
Through-Silicon Via to Dominate the Market – By Technology
According to Rahul, Senior Research Analyst, 6Wresearch, the Through-Silicon Via segment dominates the Romania 3D ICs Market due to its superior capability in improving chip performance, reducing signal transmission delays, and enabling higher integration density. With the advancement of TSV technology, it is increasingly becoming popular in applications where fast data transfer and more compact semiconductor designs are necessary, such as memory chips, AI processors, and networking technologies. With high performance computing, smart consumer electronics, and automotive semiconductor designs becoming increasingly important, the market for TSV ICs is experiencing accelerated growth. Moreover, increasing advancements in semiconductor design manufacturing technologies will help ensure future dominance of TSV in Romania.
Consumer Electronics to Dominate the Market – By End User
Consumer Electronics constitutes the leading segment of the market due to increasing demand for smartphones, video games, wearable products, and smart homes. The adoption of advanced architecture in 3D IC is continuously increasing due to its benefits like improved process speed, lower power requirements, and miniaturization. Increasing consumer inclination toward connected and intelligent devices is also encouraging semiconductor developments in the electronics industry. Moreover, growing use of high-performance memory and imaging solutions in handheld devices will make the consumer electronics segment a dominant one over the forecast period.
Memory Segment to Dominate the Market – By Application
The Memory segment holds a leading position in the industry due to rising demand for high-capacity and high-speed memory solutions across data centers, AI systems, and consumer electronics. 3D IC technology enhances memory density, efficiency, and data transfer capability and hence proves to be an ideal choice for meeting present day needs of computing. Growing trend toward cloud computing, AI-based applications, and gaming is expected to drive demand for new memory architectures. Rising investment in HPC facilities and manufacturing of smart electronics will further support growth in the Romanian memory market.
Key Attractiveness of the Report
- 10 Years of Market Numbers.
- Historical Data Starting from 2022 to 2025.
- Base Year: 2025.
- Forecast Data until 2032.
- Key Performance Indicators Impacting the Market.
- Major Upcoming Developments and Projects.
Key Highlights of the Report:
- Romania 3D Ics Market Outlook
- Market Size of Romania 3D Ics Market, 2025
- Forecast of Romania 3D Ics Market, 2032
- Historical Data and Forecast of Romania 3D Ics Revenues & Volume for the Period 2022-2032F
- Romania 3D Ics Market Trend Evolution
- Romania 3D Ics Market Drivers and Challenges
- Romania 3D Ics Price Trends
- Romania 3D Ics Porter's Five Forces
- Romania 3D Ics Industry Life Cycle
- Historical Data and Forecast of Romania 3D Ics Market Revenues & Volume By Technology for the Period 2022-2032F
- Historical Data and Forecast of Romania 3D Ics Market Revenues & Volume By Through-Silicon Via for the Period 2022-2032F
- Historical Data and Forecast of Romania 3D Ics Market Revenues & Volume By Package-on-Package for the Period 2022-2032F
- Historical Data and Forecast of Romania 3D Ics Market Revenues & Volume By Application for the Period 2022-2032F
- Historical Data and Forecast of Romania 3D Ics Market Revenues & Volume By Memory for the Period 2022-2032F
- Historical Data and Forecast of Romania 3D Ics Market Revenues & Volume By Imaging for the Period 2022-2032F
- Historical Data and Forecast of Romania 3D Ics Market Revenues & Volume By Networking for the Period 2022-2032F
- Historical Data and Forecast of Romania 3D Ics Market Revenues & Volume By Manufacturing Process for the Period 2022-2032F
- Historical Data and Forecast of Romania 3D Ics Market Revenues & Volume By Stacked for the Period 2022-2032F
- Historical Data and Forecast of Romania 3D Ics Market Revenues & Volume By Monolithic for the Period 2022-2032F
- Historical Data and Forecast of Romania 3D Ics Market Revenues & Volume By End user for the Period 2022-2032F
- Historical Data and Forecast of Romania 3D Ics Market Revenues & Volume By Automotive for the Period 2022-2032F
- Historical Data and Forecast of Romania 3D Ics Market Revenues & Volume By Consumer Electronics for the Period 2022-2032F
- Romania 3D Ics Import Export Trade Statistics
- Market Opportunity Assessment By Technology
- Market Opportunity Assessment By Application
- Market Opportunity Assessment By Manufacturing Process
- Market Opportunity Assessment By End user
- Romania 3D Ics Top Companies Market Share
- Romania 3D Ics Competitive Benchmarking By Technical and Operational Parameters
- Romania 3D Ics Company Profiles
- Romania 3D Ics Key Strategic Recommendations
Romania 3D Ics Market (2026-2032) : FAQs
The Romania 3D ICs Market is projected to grow at a CAGR of 10.1% during the forecast period 2026-2032.
Government support includes participation in the European Chips Act, funding for digital manufacturing projects and industrial innovation programs.
New opportunities include investments in semiconductors for AI chips, electric vehicles, consumer goods, networks, and semiconductors R&D facilities.
The Romania 3D ICs Market is set to grow by increased demand for semiconductors and increased use of high-performance integrated circuit technology solutions.
6Wresearch actively monitors the Romania 3D Ics Market and publishes its comprehensive annual report, highlighting emerging trends, growth drivers, revenue analysis, and forecast outlook. Our insights help businesses to make data-backed strategic decisions with ongoing market dynamics. Our analysts track relevent industries related to the Romania 3D Ics Market, allowing our clients with actionable intelligence and reliable forecasts tailored to emerging regional needs.
Yes, we provide customisation as per your requirements. To learn more, feel free to contact us on sales@6wresearch.com
|
1 Executive Summary |
|
2 Introduction |
|
2.1 Key Highlights of the Report |
|
2.2 Report Description |
|
2.3 Market Scope & Segmentation |
|
2.4 Research Methodology |
|
2.5 Assumptions |
|
3 Romania 3D Ics Market Overview |
|
3.1 Romania Country Macro Economic Indicators |
|
3.2 Romania 3D Ics Market Revenues & Volume, 2022 & 2032F |
|
3.3 Romania 3D Ics Market - Industry Life Cycle |
|
3.4 Romania 3D Ics Market - Porter's Five Forces |
|
3.5 Romania 3D Ics Market Revenues & Volume Share, By Technology, 2022 & 2032F |
|
3.6 Romania 3D Ics Market Revenues & Volume Share, By Application, 2022 & 2032F |
|
3.7 Romania 3D Ics Market Revenues & Volume Share, By Manufacturing Process, 2022 & 2032F |
|
3.8 Romania 3D Ics Market Revenues & Volume Share, By End user, 2022 & 2032F |
|
4 Romania 3D Ics Market Dynamics |
|
4.1 Impact Analysis |
|
4.2 Market Drivers |
|
4.2.1 Increasing demand for advanced consumer electronics in Romania |
|
4.2.2 Growing adoption of Internet of Things (IoT) devices in various industries |
|
4.2.3 Rising investments in research and development for 3D integrated circuits (ICs) technologies |
|
4.3 Market Restraints |
|
4.3.1 High initial investment costs associated with implementing 3D ICs technology |
|
4.3.2 Lack of skilled professionals in the field of 3D ICs design and manufacturing |
|
4.3.3 Regulatory challenges related to intellectual property rights and data security in Romania |
|
5 Romania 3D Ics Market Trends |
|
6 Romania 3D Ics Market, By Types |
|
6.1 Romania 3D Ics Market, By Technology |
|
6.1.1 Overview and Analysis |
|
6.1.2 Romania 3D Ics Market Revenues & Volume, By Technology, 2022 - 2032F |
|
6.1.3 Romania 3D Ics Market Revenues & Volume, By Through-Silicon Via, 2022 - 2032F |
|
6.1.4 Romania 3D Ics Market Revenues & Volume, By Package-on-Package, 2022 - 2032F |
|
6.2 Romania 3D Ics Market, By Application |
|
6.2.1 Overview and Analysis |
|
6.2.2 Romania 3D Ics Market Revenues & Volume, By Memory, 2022 - 2032F |
|
6.2.3 Romania 3D Ics Market Revenues & Volume, By Imaging, 2022 - 2032F |
|
6.2.4 Romania 3D Ics Market Revenues & Volume, By Networking, 2022 - 2032F |
|
6.3 Romania 3D Ics Market, By Manufacturing Process |
|
6.3.1 Overview and Analysis |
|
6.3.2 Romania 3D Ics Market Revenues & Volume, By Stacked, 2022 - 2032F |
|
6.3.3 Romania 3D Ics Market Revenues & Volume, By Monolithic, 2022 - 2032F |
|
6.4 Romania 3D Ics Market, By End user |
|
6.4.1 Overview and Analysis |
|
6.4.2 Romania 3D Ics Market Revenues & Volume, By Automotive, 2022 - 2032F |
|
6.4.3 Romania 3D Ics Market Revenues & Volume, By Consumer Electronics, 2022 - 2032F |
|
7 Romania 3D Ics Market Import-Export Trade Statistics |
|
7.1 Romania 3D Ics Market Export to Major Countries |
|
7.2 Romania 3D Ics Market Imports from Major Countries |
|
8 Romania 3D Ics Market Key Performance Indicators |
|
8.1 Average time to market for new 3D ICs products |
|
8.2 Number of patents filed for 3D ICs technologies in Romania |
|
8.3 Rate of adoption of 3D ICs in key industries in Romania |
|
9 Romania 3D Ics Market - Opportunity Assessment |
|
9.1 Romania 3D Ics Market Opportunity Assessment, By Technology, 2022 & 2032F |
|
9.2 Romania 3D Ics Market Opportunity Assessment, By Application, 2022 & 2032F |
|
9.3 Romania 3D Ics Market Opportunity Assessment, By Manufacturing Process, 2022 & 2032F |
|
9.4 Romania 3D Ics Market Opportunity Assessment, By End user, 2022 & 2032F |
|
10 Romania 3D Ics Market - Competitive Landscape |
|
10.1 Romania 3D Ics Market Revenue Share, By Companies, 2025 |
|
10.2 Romania 3D Ics Market Competitive Benchmarking, By Operating and Technical Parameters |
|
11 Company Profiles |
|
12 Recommendations |
|
13 Disclaimer |
Global Go To Market Strategy - 2030
Export potential enables firms to identify high-growth global markets with greater confidence by combining advanced trade intelligence with a structured quantitative methodology. The framework analyzes emerging demand trends and country-level import patterns while integrating macroeconomic and trade datasets such as GDP and population forecasts, bilateral import–export flows, tariff structures, elasticity differentials between developed and developing economies, geographic distance, and import demand projections. Using weighted trade values from 2020–2024 as the base period to project country-to-country export potential for 2030, these inputs are operationalized through calculated drivers such as gravity model parameters, tariff impact factors, and projected GDP per-capita growth. Through an analysis of hidden potentials, demand hotspots, and market conditions that are most favorable to success, this method enables firms to focus on target countries, maximize returns, and global expansion with data, backed by accuracy.
By factoring in the projected importer demand gap that is currently unmet and could be potential opportunity, it identifies the potential for the Exporter (Country) among 190 countries, against the general trade analysis, which identifies the biggest importer or exporter.
To discover high-growth global markets and optimize your business strategy:
Click Here
Pricing
- Single User License$ 1,995
- Department License$ 2,400
- Site License$ 3,120
- Global License$ 3,795

Leadership Perspectives from Industry Events
Search
Thought Leadership and Analyst Meet


Our Clients
6WResearch In News
- Doha a strategic location for EV manufacturing hub: IPA Qatar
- Demand for luxury TVs surging in the GCC, says Samsung
- Empowering Growth: The Thriving Journey of Bangladesh’s Cable Industry
- Demand for luxury TVs surging in the GCC, says Samsung
- Video call with a traditional healer? Once unthinkable, it’s now common in South Africa
- Intelligent Buildings To Smooth GCC’s Path To Net Zero
Latest Reports
- Cape Verde Portable Hand-Thrown Extinguisher Market (2026-2032)
- Canada Portable Hand-Thrown Extinguisher Market (2026-2032)
- Cameroon Portable Hand-Thrown Extinguisher Market (2026-2032)
- Burundi Portable Hand-Thrown Extinguisher Market (2026-2032)
- Burkina Faso Portable Hand-Thrown Extinguisher Market (2026-2032)
- Bulgaria Portable Hand-Thrown Extinguisher Market (2026-2032)
- Brunei Portable Hand-Thrown Extinguisher Market (2026-2032)
- Botswana Portable Hand-Thrown Extinguisher Market (2026-2032)
- Bosnia and Herzegovina Portable Hand-Thrown Extinguisher Market (2026-2032)
- Bolivia Portable Hand-Thrown Extinguisher Market (2026-2032)
Industry Events and Analyst Meet

HIMTEX 2026

India Refining Summit 2026

India EV Show 2026

EV tech India Expo 2026

Auto Tech Asia 2026
Whitepaper
- Middle East & Africa Commercial Security Market Click here to view more.
- Middle East & Africa Fire Safety Systems & Equipment Market Click here to view more.
- GCC Drone Market Click here to view more.
- Middle East Lighting Fixture Market Click here to view more.
- GCC Physical & Perimeter Security Market Click here to view more.