Romania Black Board Market (2026-2032) Outlook | Trends, Forecast, Analysis, Revenue, Share, Size, Industry, Growth, Companies & Value
Market Forecast By Product Type (Wall-mounted Board, Mobile Board, Others), By Application (Schools, Office, Family, Others) And Competitive Landscape
| Product Code: ETC315138 | Publication Date: Aug 2022 | Updated Date: Apr 2026 | Product Type: Market Research Report | |
| Publisher: 6Wresearch | Author: Ravi Bhandari | No. of Pages: 75 | No. of Figures: 35 | No. of Tables: 20 |
Romania Black Board Market Size (2020-2030)
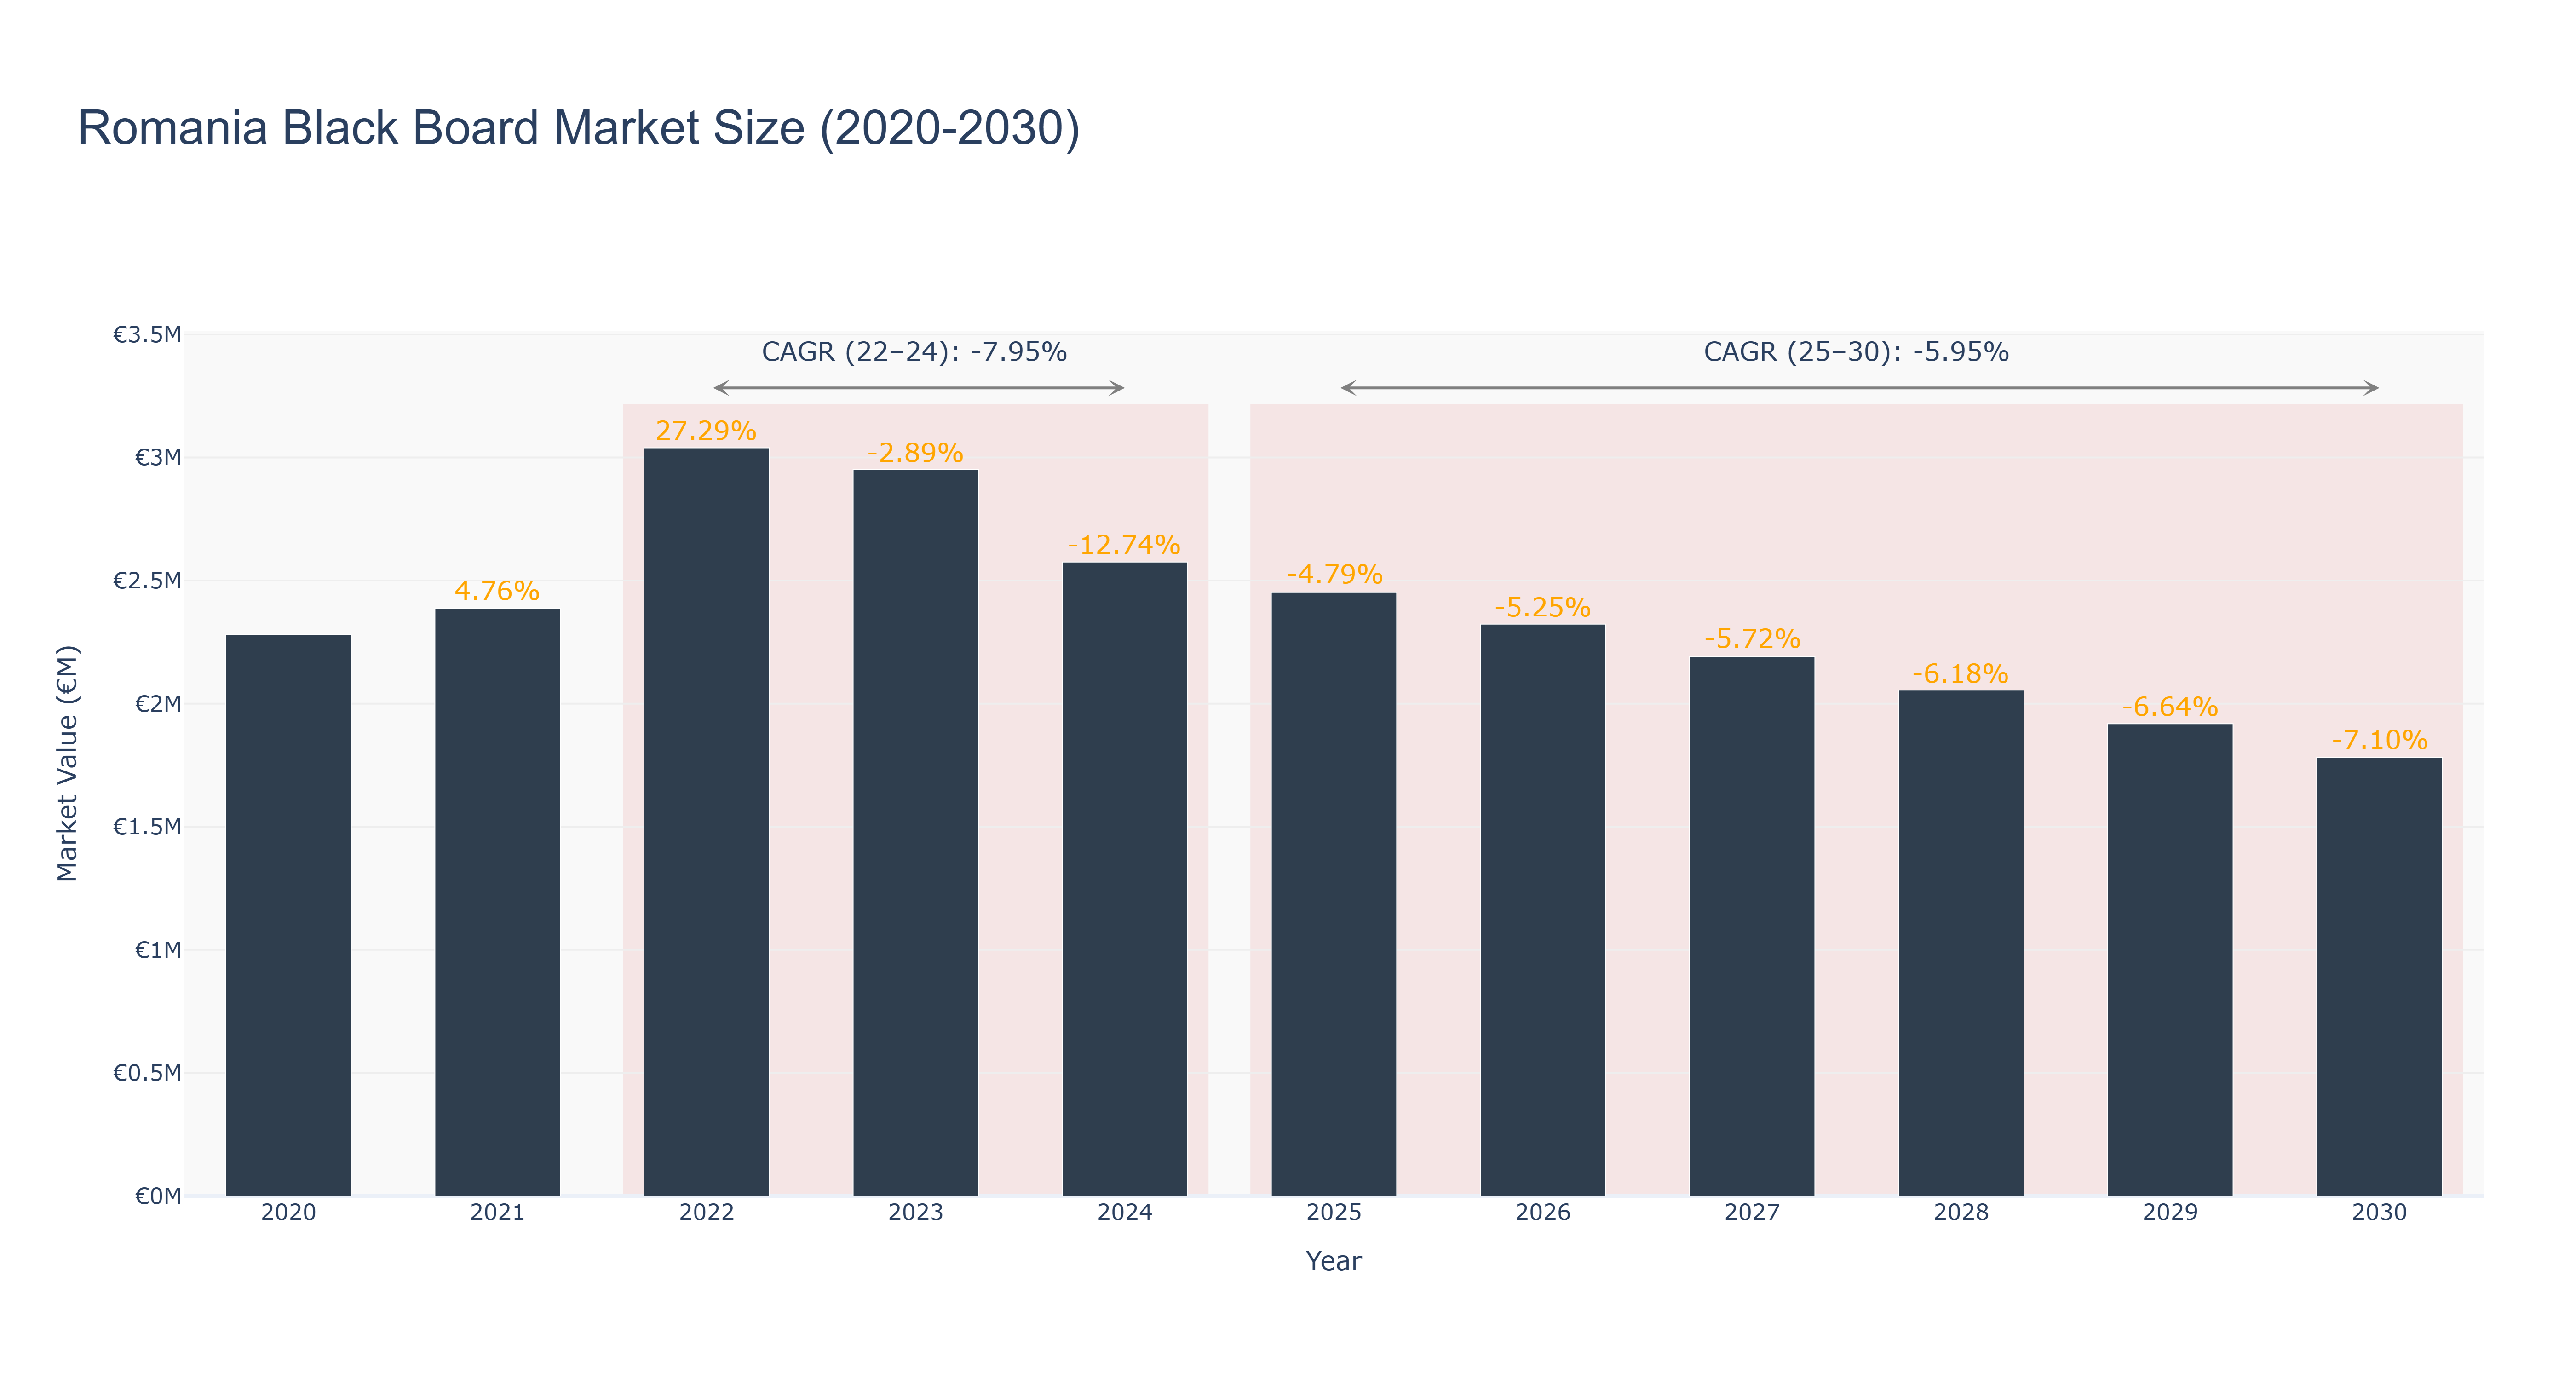
Romania Black Board Market has seen fluctuations in market size over the years. The peak market size of €3.04 million was recorded in 2022, followed by a decline to €2.58 million in 2024. Forecasted market size is expected to decrease further to €1.78 million by 2030, with a CAGR of -5.95% from 2025 to 2030. The market experienced a negative CAGR of -7.95% from 2022 to 2024. The downward trend can be attributed to economic uncertainties affecting consumer spending. However, the market is expected to stabilize with improved economic conditions and technological advancements in educational tools. Recent developments in digital learning platforms and government initiatives to enhance education infrastructure are anticipated to drive growth in the Romania Black Board Market in the coming years.
Romania Black Board Market: Production & Trade Performance (2019-2025)
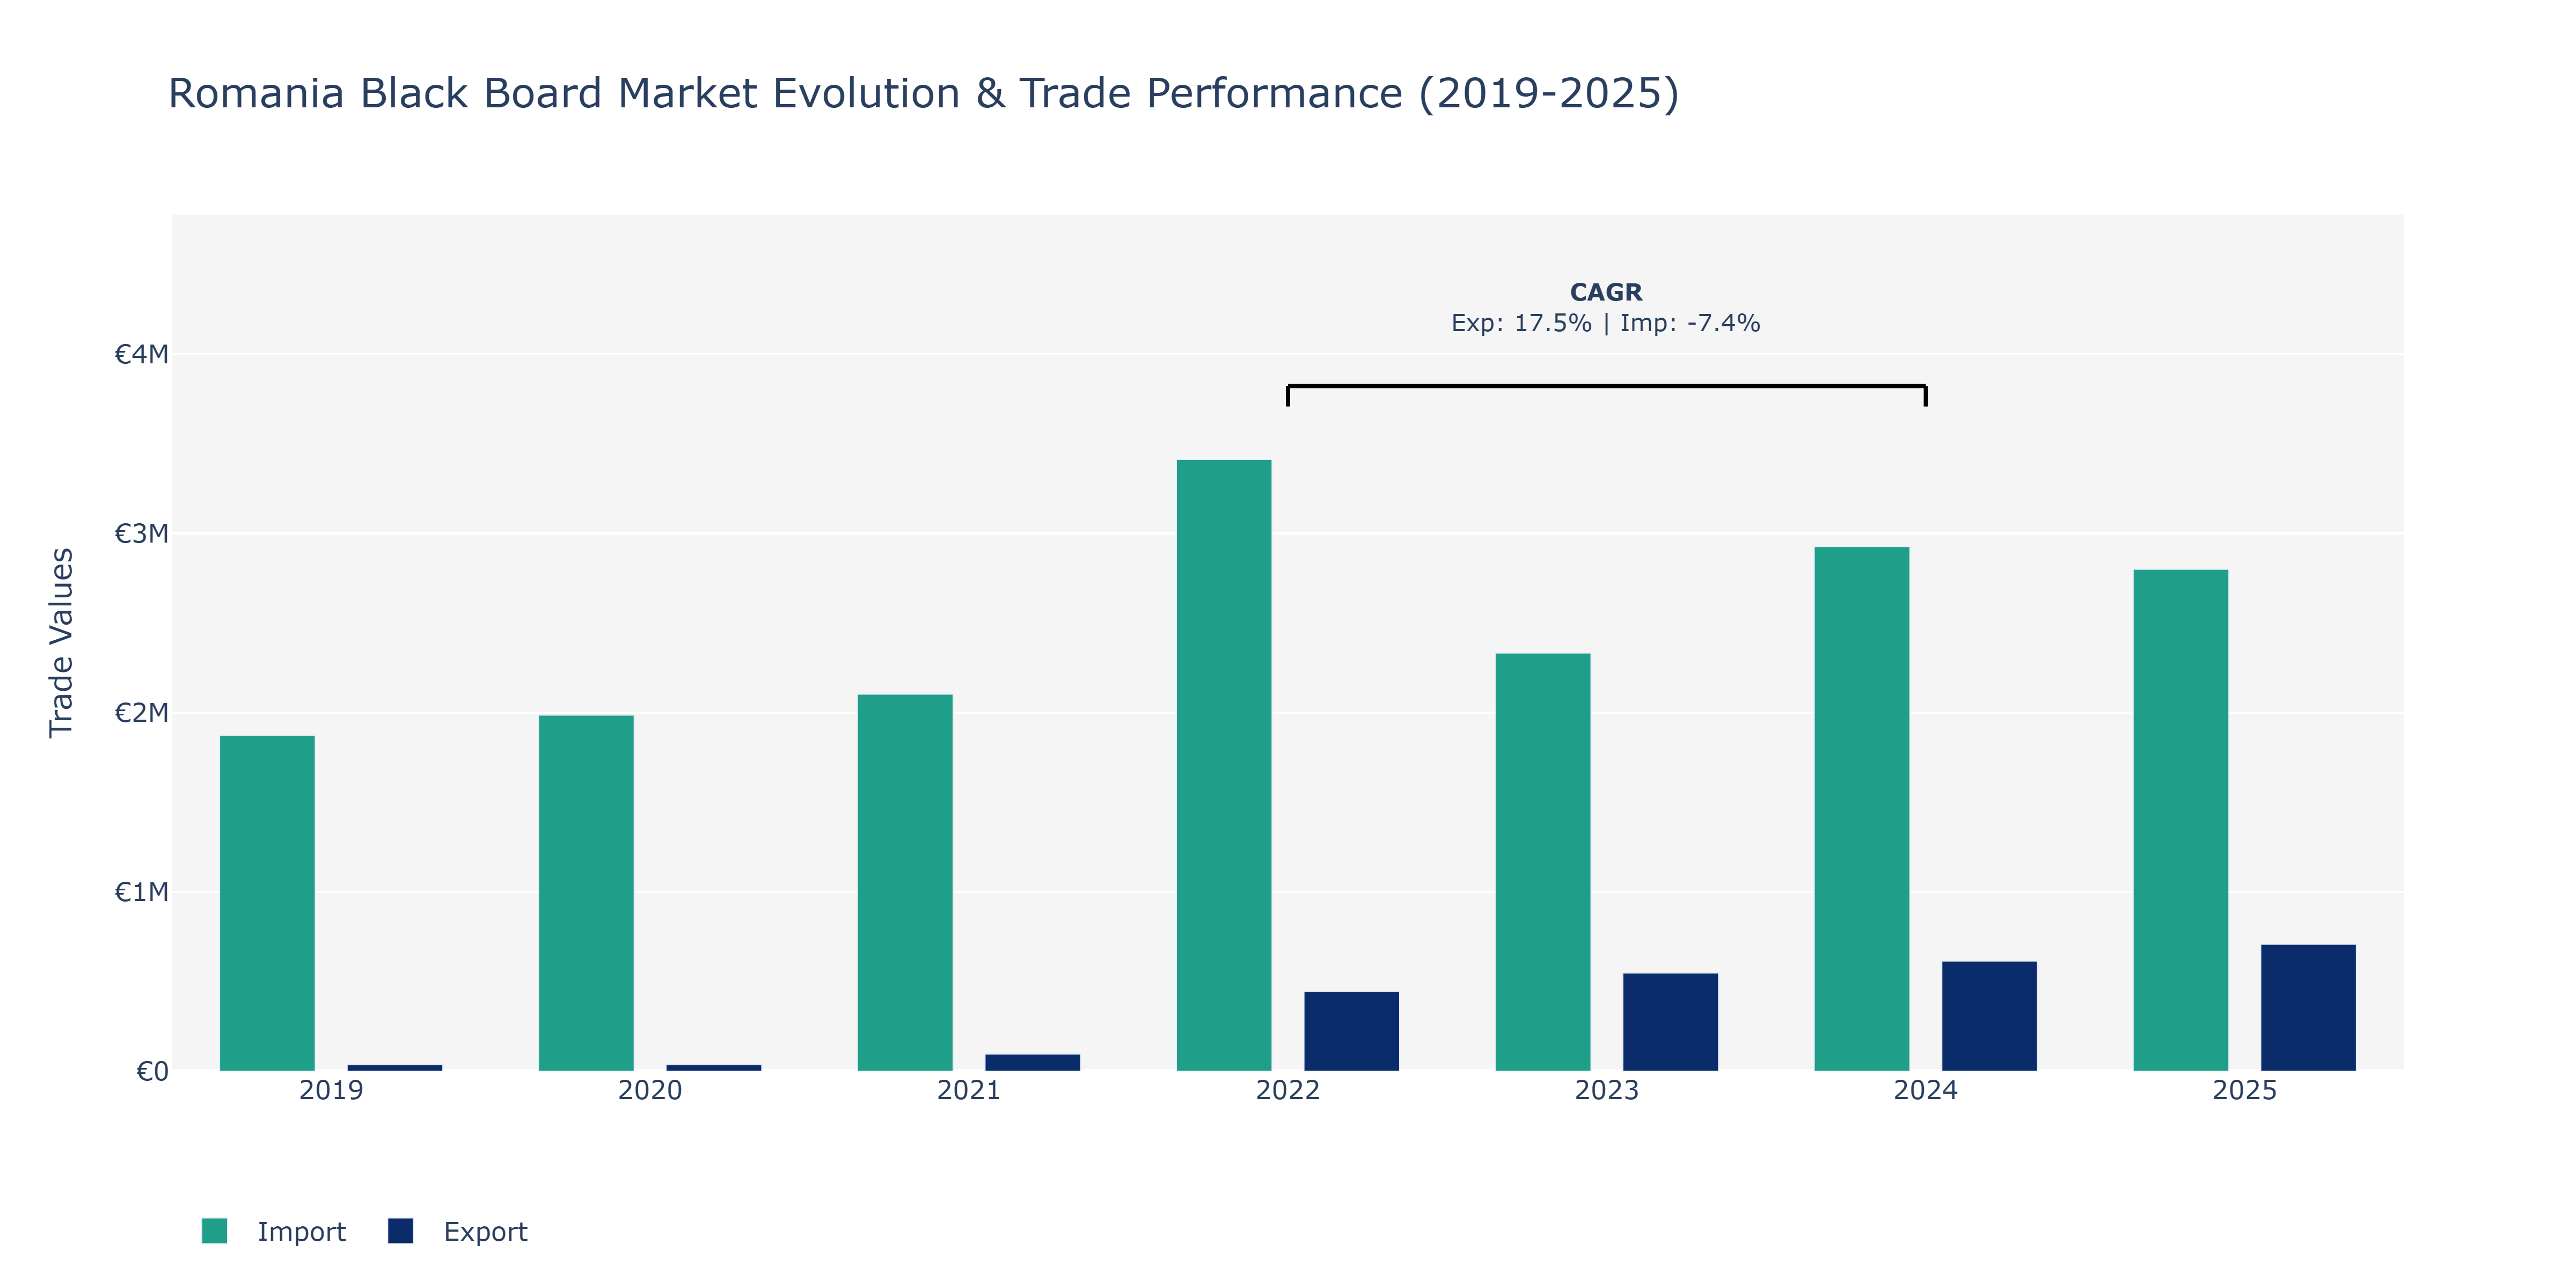
Between 2019 and 2025, Romania's Black Board Market showcased notable fluctuations in exports and imports. The market saw a steady increase in exports from €36.1 thousand in 2019 to €708.17 thousand in 2025, indicating a positive growth trend over the years. Conversely, imports peaked in 2022 at €3.41 million before experiencing a decline to €2.8 million in 2025. The surge in exports can be attributed to the rising demand for high-quality blackboards in educational institutions coupled with efficient production processes. The dip in imports post-2022 may be linked to local manufacturers enhancing their production capabilities, reducing the reliance on foreign suppliers. These shifts highlight a potential shift towards self-sufficiency in blackboard manufacturing within Romania, ensuring a more stable market position.
Key Highlights of the Report:
- Romania Black Board Market Outlook
- Market Size of Romania Black Board Market, 2025
- Forecast of Romania Black Board Market, 2032
- Historical Data and Forecast of Romania Black Board Revenues & Volume for the Period 2022-2032F
- Romania Black Board Market Trend Evolution
- Romania Black Board Market Drivers and Challenges
- Romania Black Board Price Trends
- Romania Black Board Porter's Five Forces
- Romania Black Board Industry Life Cycle
- Historical Data and Forecast of Romania Black Board Market Revenues & Volume By Product Type for the Period 2022-2032F
- Historical Data and Forecast of Romania Black Board Market Revenues & Volume By Wall-mounted Board for the Period 2022-2032F
- Historical Data and Forecast of Romania Black Board Market Revenues & Volume By Mobile Board for the Period 2022-2032F
- Historical Data and Forecast of Romania Black Board Market Revenues & Volume By Others for the Period 2022-2032F
- Historical Data and Forecast of Romania Black Board Market Revenues & Volume By Application for the Period 2022-2032F
- Historical Data and Forecast of Romania Black Board Market Revenues & Volume By Schools for the Period 2022-2032F
- Historical Data and Forecast of Romania Black Board Market Revenues & Volume By Office for the Period 2022-2032F
- Historical Data and Forecast of Romania Black Board Market Revenues & Volume By Family for the Period 2022-2032F
- Historical Data and Forecast of Romania Black Board Market Revenues & Volume By Others for the Period 2022-2032F
- Romania Black Board Import Export Trade Statistics
- Market Opportunity Assessment By Product Type
- Market Opportunity Assessment By Application
- Romania Black Board Top Companies Market Share
- Romania Black Board Competitive Benchmarking By Technical and Operational Parameters
- Romania Black Board Company Profiles
- Romania Black Board Key Strategic Recommendations
Frequently Asked Questions About the Market Study (FAQs):
6Wresearch actively monitors the Romania Black Board Market and publishes its comprehensive annual report, highlighting emerging trends, growth drivers, revenue analysis, and forecast outlook. Our insights help businesses to make data-backed strategic decisions with ongoing market dynamics. Our analysts track relevent industries related to the Romania Black Board Market, allowing our clients with actionable intelligence and reliable forecasts tailored to emerging regional needs.
Yes, we provide customisation as per your requirements. To learn more, feel free to contact us on sales@6wresearch.com
1 Executive Summary |
2 Introduction |
2.1 Key Highlights of the Report |
2.2 Report Description |
2.3 Market Scope & Segmentation |
2.4 Research Methodology |
2.5 Assumptions |
3 Romania Black Board Market Overview |
3.1 Romania Country Macro Economic Indicators |
3.2 Romania Black Board Market Revenues & Volume, 2022 & 2032F |
3.3 Romania Black Board Market - Industry Life Cycle |
3.4 Romania Black Board Market - Porter's Five Forces |
3.5 Romania Black Board Market Revenues & Volume Share, By Product Type, 2022 & 2032F |
3.6 Romania Black Board Market Revenues & Volume Share, By Application, 2022 & 2032F |
4 Romania Black Board Market Dynamics |
4.1 Impact Analysis |
4.2 Market Drivers |
4.2.1 Increasing adoption of digital learning technologies in education sector |
4.2.2 Growing demand for interactive and collaborative learning tools |
4.2.3 Rise in popularity of remote work and online meetings, driving the need for black boards for presentations |
4.3 Market Restraints |
4.3.1 Competition from digital whiteboards and other advanced presentation tools |
4.3.2 Economic uncertainty impacting spending on non-essential items like black boards |
4.3.3 Limited awareness and penetration of black boards in certain regions of Romania |
5 Romania Black Board Market Trends |
6 Romania Black Board Market, By Types |
6.1 Romania Black Board Market, By Product Type |
6.1.1 Overview and Analysis |
6.1.2 Romania Black Board Market Revenues & Volume, By Product Type, 2022 - 2032F |
6.1.3 Romania Black Board Market Revenues & Volume, By Wall-mounted Board, 2022 - 2032F |
6.1.4 Romania Black Board Market Revenues & Volume, By Mobile Board, 2022 - 2032F |
6.1.5 Romania Black Board Market Revenues & Volume, By Others, 2022 - 2032F |
6.2 Romania Black Board Market, By Application |
6.2.1 Overview and Analysis |
6.2.2 Romania Black Board Market Revenues & Volume, By Schools, 2022 - 2032F |
6.2.3 Romania Black Board Market Revenues & Volume, By Office, 2022 - 2032F |
6.2.4 Romania Black Board Market Revenues & Volume, By Family, 2022 - 2032F |
6.2.5 Romania Black Board Market Revenues & Volume, By Others, 2022 - 2032F |
7 Romania Black Board Market Import-Export Trade Statistics |
7.1 Romania Black Board Market Export to Major Countries |
7.2 Romania Black Board Market Imports from Major Countries |
8 Romania Black Board Market Key Performance Indicators |
8.1 Adoption rate of digital learning technologies in schools and universities |
8.2 Number of online meetings and webinars conducted in Romania |
8.3 Percentage growth in sales of black boards in urban vs. rural areas |
8.4 Average time spent on presentations and training sessions using black boards |
9 Romania Black Board Market - Opportunity Assessment |
9.1 Romania Black Board Market Opportunity Assessment, By Product Type, 2022 & 2032F |
9.2 Romania Black Board Market Opportunity Assessment, By Application, 2022 & 2032F |
10 Romania Black Board Market - Competitive Landscape |
10.1 Romania Black Board Market Revenue Share, By Companies, 2025 |
10.2 Romania Black Board Market Competitive Benchmarking, By Operating and Technical Parameters |
11 Company Profiles |
12 Recommendations |
13 Disclaimer |
Global Go To Market Strategy - 2030
Export potential enables firms to identify high-growth global markets with greater confidence by combining advanced trade intelligence with a structured quantitative methodology. The framework analyzes emerging demand trends and country-level import patterns while integrating macroeconomic and trade datasets such as GDP and population forecasts, bilateral import–export flows, tariff structures, elasticity differentials between developed and developing economies, geographic distance, and import demand projections. Using weighted trade values from 2020–2024 as the base period to project country-to-country export potential for 2030, these inputs are operationalized through calculated drivers such as gravity model parameters, tariff impact factors, and projected GDP per-capita growth. Through an analysis of hidden potentials, demand hotspots, and market conditions that are most favorable to success, this method enables firms to focus on target countries, maximize returns, and global expansion with data, backed by accuracy.
By factoring in the projected importer demand gap that is currently unmet and could be potential opportunity, it identifies the potential for the Exporter (Country) among 190 countries, against the general trade analysis, which identifies the biggest importer or exporter.
To discover high-growth global markets and optimize your business strategy:
Click Here
Pricing
- Single User License$ 1,995
- Department License$ 2,400
- Site License$ 3,120
- Global License$ 3,795

Leadership Perspectives from Industry Events
Search
Thought Leadership and Analyst Meet


Our Clients
6WResearch In News
- India Air Conditioner Market Set for Strong Rebound in 2026 After Weather-Led Correction and GST-Driven Recovery: 6Wresearch
- ADAS in India: How Automatic Emergency Braking, Blind Spot Detection & Driver Monitoring are Transforming Road Safety
- Doha a strategic location for EV manufacturing hub: IPA Qatar
- Demand for luxury TVs surging in the GCC, says Samsung
- Empowering Growth: The Thriving Journey of Bangladesh’s Cable Industry
- Demand for luxury TVs surging in the GCC, says Samsung
Latest Reports
- Poland Fire Protection Systems Market (2026-2032)
- Cape Verde Portable Hand-Thrown Extinguisher Market (2026-2032)
- Canada Portable Hand-Thrown Extinguisher Market (2026-2032)
- Cameroon Portable Hand-Thrown Extinguisher Market (2026-2032)
- Burundi Portable Hand-Thrown Extinguisher Market (2026-2032)
- Burkina Faso Portable Hand-Thrown Extinguisher Market (2026-2032)
- Bulgaria Portable Hand-Thrown Extinguisher Market (2026-2032)
- Brunei Portable Hand-Thrown Extinguisher Market (2026-2032)
- Botswana Portable Hand-Thrown Extinguisher Market (2026-2032)
- Bosnia and Herzegovina Portable Hand-Thrown Extinguisher Market (2026-2032)
Industry Events and Analyst Meet

HIMTEX 2026

India Refining Summit 2026

India EV Show 2026

EV tech India Expo 2026

Auto Tech Asia 2026
Whitepaper
- Middle East & Africa Commercial Security Market Click here to view more.
- Middle East & Africa Fire Safety Systems & Equipment Market Click here to view more.
- GCC Drone Market Click here to view more.
- Middle East Lighting Fixture Market Click here to view more.
- GCC Physical & Perimeter Security Market Click here to view more.