Romania Inorganic Chemicals Market (2026-2032) Outlook | Forecast, Trends, Share, Industry, Growth, Value, Size, Companies, Revenue & Analysis
Market Forecast By Type (Ammonia, Chlor alkali, Ammonium nitrate, Ammonium sulfate, Inorganic acid, Sodium hydroxide, Hydrogen peroxide, Oxygen) And Competitive Landscape
| Product Code: ETC329418 | Publication Date: Aug 2022 | Updated Date: Apr 2026 | Product Type: Market Research Report | |
| Publisher: 6Wresearch | Author: Ravi Bhandari | No. of Pages: 75 | No. of Figures: 35 | No. of Tables: 20 |
Romania Inorganic Chemicals Market Size (2020-2030)
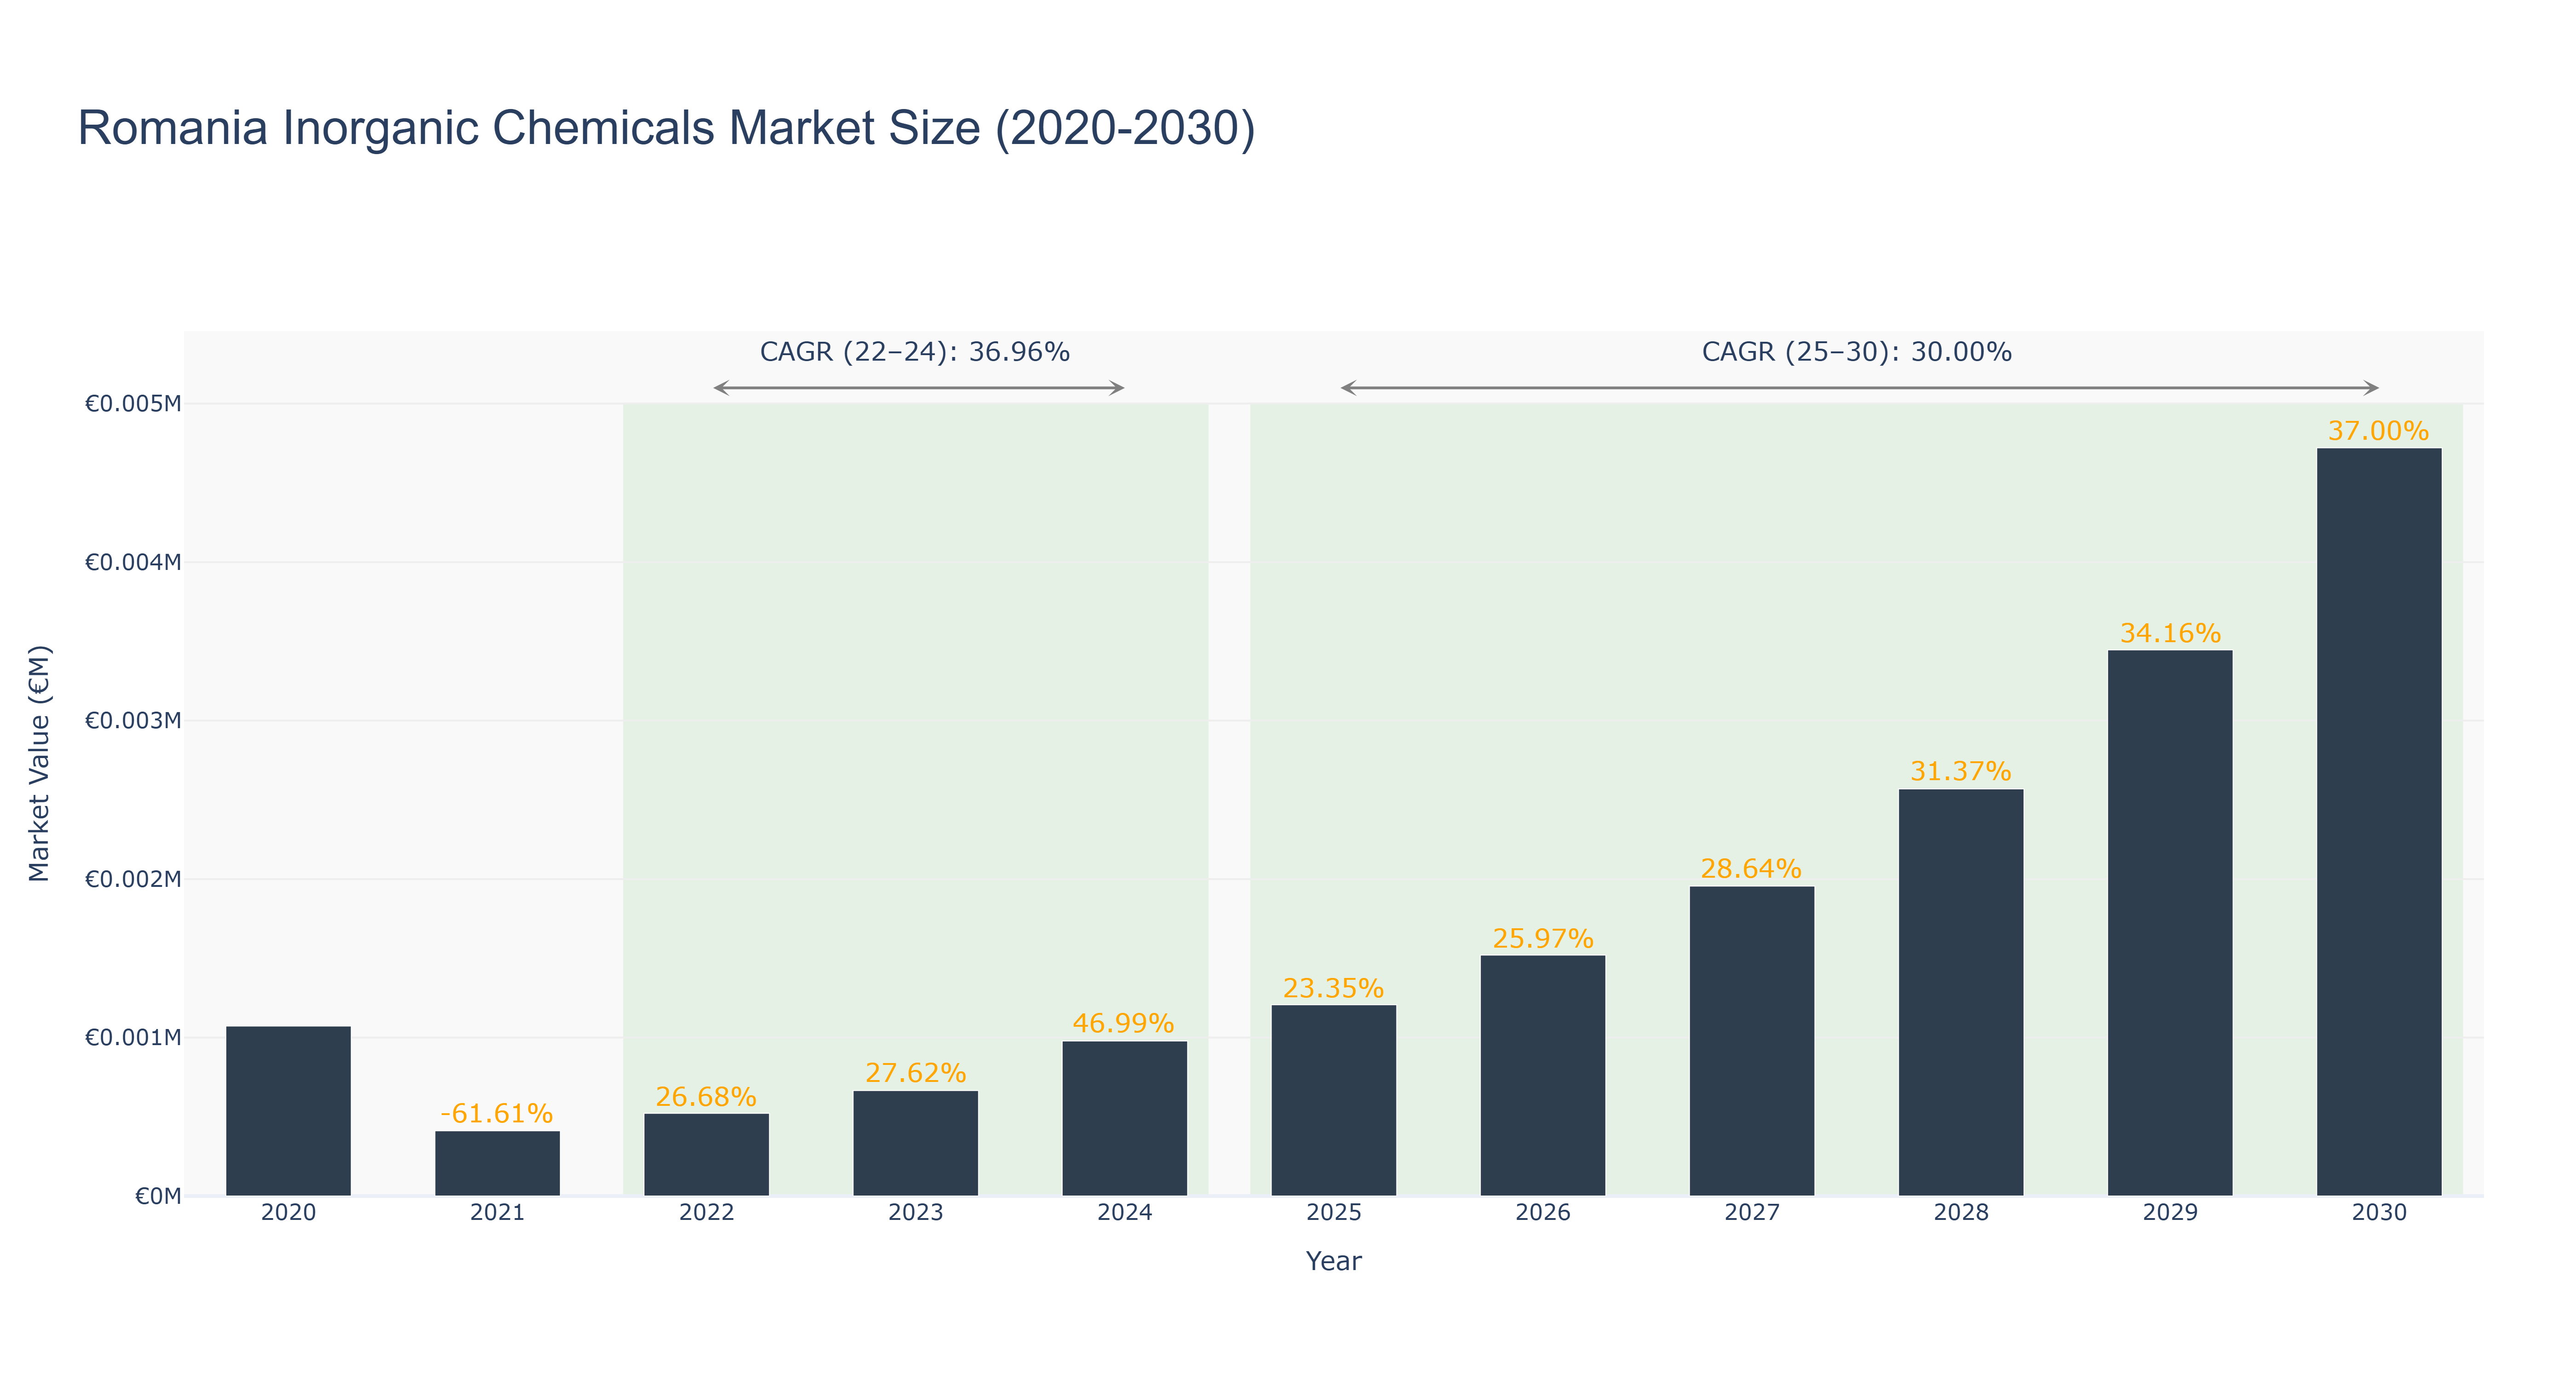
The Romania Inorganic Chemicals Market has experienced a dynamic trajectory, marked by significant fluctuations in market size. After a challenging decline in 2021, where the market size plummeted to €411.60 million, the sector rebounded robustly, achieving a peak market size of €978.10 million in 2024, with an impressive actual CAGR of 36.96% from 2022 to 2024. Looking ahead, the forecasted period from 2025 to 2030 anticipates continued growth, with projected market sizes reaching €4.72 billion by 2030 and a CAGR of 30.00%. Key drivers for this growth include increasing industrial demand, investments in sustainable production technologies, and expanding applications across various sectors. As Romania enhances its chemical manufacturing capabilities, upcoming investments in infrastructure and innovation are expected to further strengthen the market, positioning it as a vital player in the European inorganic chemicals landscape.
Romania Inorganic Chemicals Market: Production & Trade Performance (2019-2025)
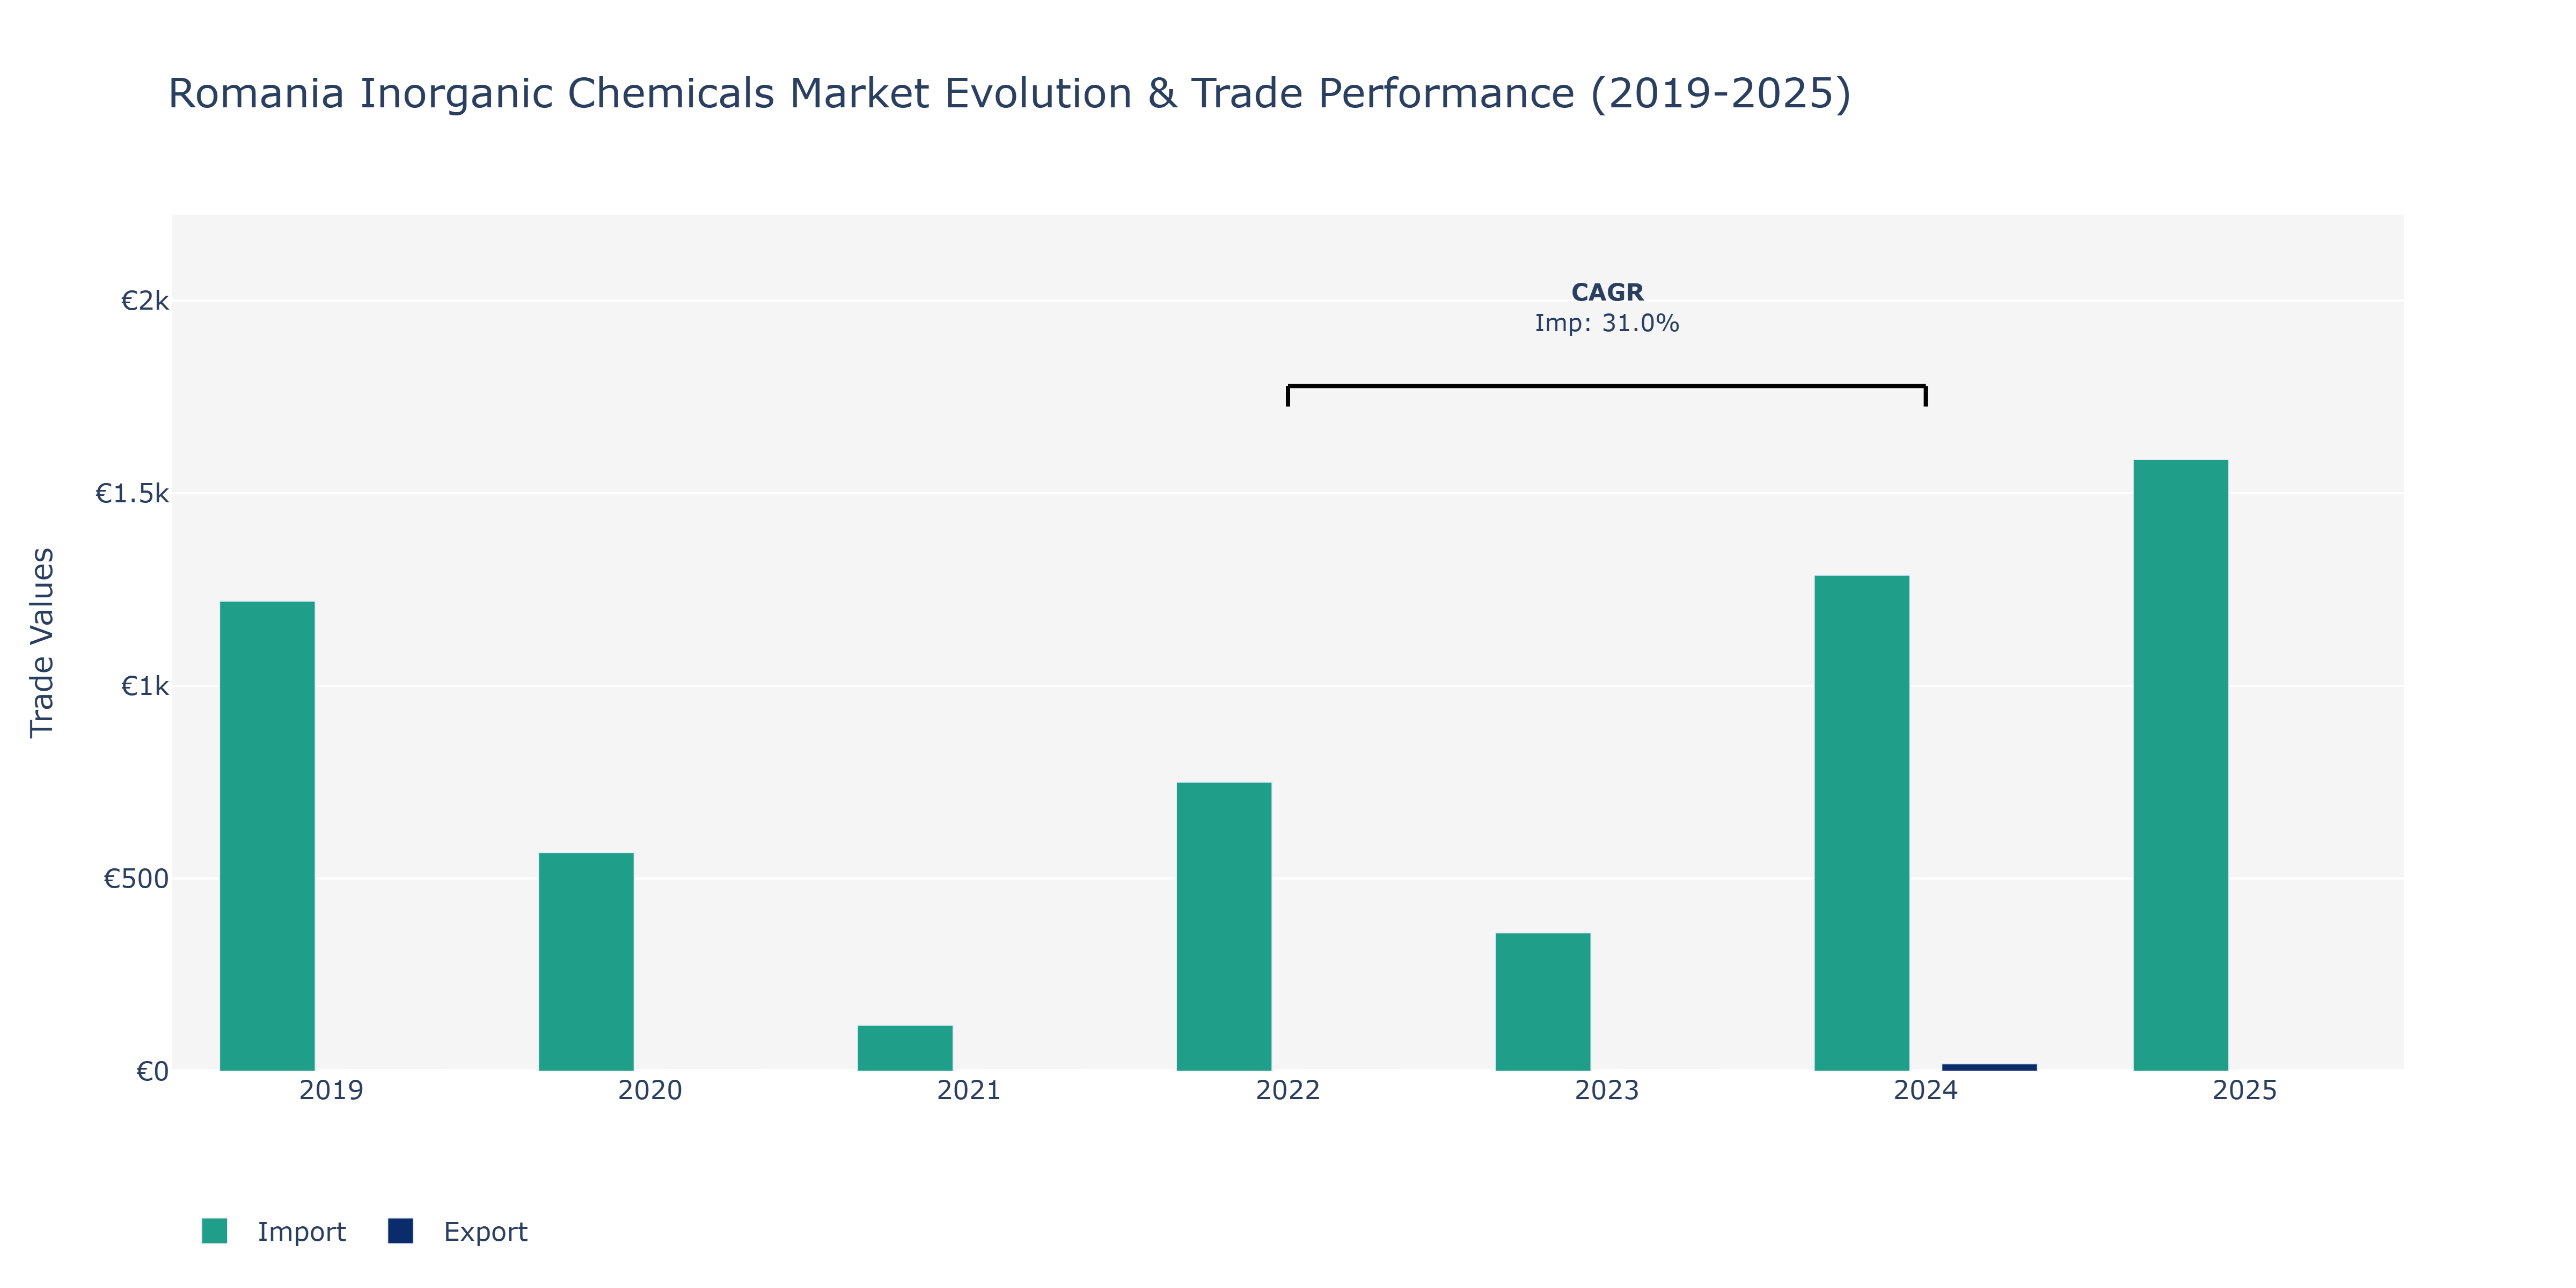
The Romania Inorganic Chemicals Market witnessed fluctuations in exports and imports between 2019 and 2025. In 2019, imports stood at €1.22 thousand, declining sharply in 2020 to €567 million due to economic uncertainties. The trend reversed in 2021 with imports decreasing further to €119 million, possibly impacted by supply chain disruptions. A notable peak in imports was observed in 2022, reaching €750 million, attributed to increased demand for raw materials. However, imports surged in 2025 to €1.59 thousand, indicating a strategic shift in procurement strategies or a push for enhanced manufacturing capabilities. In 2024, exports commenced at €19 million, showcasing potential market diversification efforts. Factors such as evolving regulatory landscapes, technological advancements, and global demand shifts may have influenced these trends in the Romania Inorganic Chemicals Market.
Key Highlights of the Report:
- Romania Inorganic Chemicals Market Outlook
- Market Size of Romania Inorganic Chemicals Market, 2025
- Forecast of Romania Inorganic Chemicals Market, 2032
- Historical Data and Forecast of Romania Inorganic Chemicals Revenues & Volume for the Period 2022-2032F
- Romania Inorganic Chemicals Market Trend Evolution
- Romania Inorganic Chemicals Market Drivers and Challenges
- Romania Inorganic Chemicals Price Trends
- Romania Inorganic Chemicals Porter's Five Forces
- Romania Inorganic Chemicals Industry Life Cycle
- Historical Data and Forecast of Romania Inorganic Chemicals Market Revenues & Volume By Type for the Period 2022-2032F
- Historical Data and Forecast of Romania Inorganic Chemicals Market Revenues & Volume By Ammonia for the Period 2022-2032F
- Historical Data and Forecast of Romania Inorganic Chemicals Market Revenues & Volume By Chlor alkali for the Period 2022-2032F
- Historical Data and Forecast of Romania Inorganic Chemicals Market Revenues & Volume By Ammonium nitrate for the Period 2022-2032F
- Historical Data and Forecast of Romania Inorganic Chemicals Market Revenues & Volume By Ammonium sulfate for the Period 2022-2032F
- Historical Data and Forecast of Romania Inorganic Chemicals Market Revenues & Volume By Inorganic acid for the Period 2022-2032F
- Historical Data and Forecast of Romania Inorganic Chemicals Market Revenues & Volume By Sodium hydroxide for the Period 2022-2032F
- Historical Data and Forecast of Romania Inorganic Chemicals Market Revenues & Volume By Hydrogen peroxide for the Period 2022-2032F
- Historical Data and Forecast of Romania Ammonia Inorganic Chemicals Market Revenues & Volume By Oxygen for the Period 2022-2032F
- Romania Inorganic Chemicals Import Export Trade Statistics
- Market Opportunity Assessment By Type
- Romania Inorganic Chemicals Top Companies Market Share
- Romania Inorganic Chemicals Competitive Benchmarking By Technical and Operational Parameters
- Romania Inorganic Chemicals Company Profiles
- Romania Inorganic Chemicals Key Strategic Recommendations
Frequently Asked Questions About the Market Study (FAQs):
6Wresearch actively monitors the Romania Inorganic Chemicals Market and publishes its comprehensive annual report, highlighting emerging trends, growth drivers, revenue analysis, and forecast outlook. Our insights help businesses to make data-backed strategic decisions with ongoing market dynamics. Our analysts track relevent industries related to the Romania Inorganic Chemicals Market, allowing our clients with actionable intelligence and reliable forecasts tailored to emerging regional needs.
Yes, we provide customisation as per your requirements. To learn more, feel free to contact us on sales@6wresearch.com
1 Executive Summary |
2 Introduction |
2.1 Key Highlights of the Report |
2.2 Report Description |
2.3 Market Scope & Segmentation |
2.4 Research Methodology |
2.5 Assumptions |
3 Romania Inorganic Chemicals Market Overview |
3.1 Romania Country Macro Economic Indicators |
3.2 Romania Inorganic Chemicals Market Revenues & Volume, 2022 & 2032F |
3.3 Romania Inorganic Chemicals Market - Industry Life Cycle |
3.4 Romania Inorganic Chemicals Market - Porter's Five Forces |
3.5 Romania Inorganic Chemicals Market Revenues & Volume Share, By Type, 2022 & 2032F |
4 Romania Inorganic Chemicals Market Dynamics |
4.1 Impact Analysis |
4.2 Market Drivers |
4.2.1 Growing demand for inorganic chemicals in various industries such as agriculture, construction, and automotive. |
4.2.2 Increasing investments in research and development for innovative inorganic chemical products. |
4.2.3 Favorable government policies and initiatives supporting the growth of the inorganic chemicals market in Romania. |
4.3 Market Restraints |
4.3.1 Fluctuating prices of raw materials impacting the production cost of inorganic chemicals. |
4.3.2 Environmental regulations and concerns related to the use and disposal of inorganic chemicals. |
4.3.3 Intense competition from international players in the inorganic chemicals market. |
5 Romania Inorganic Chemicals Market Trends |
6 Romania Inorganic Chemicals Market, By Types |
6.1 Romania Inorganic Chemicals Market, By Type |
6.1.1 Overview and Analysis |
6.1.2 Romania Inorganic Chemicals Market Revenues & Volume, By Type, 2022 - 2032F |
6.1.3 Romania Inorganic Chemicals Market Revenues & Volume, By Ammonia, 2022 - 2032F |
6.1.4 Romania Inorganic Chemicals Market Revenues & Volume, By Chlor alkali, 2022 - 2032F |
6.1.5 Romania Inorganic Chemicals Market Revenues & Volume, By Ammonium nitrate, 2022 - 2032F |
6.1.6 Romania Inorganic Chemicals Market Revenues & Volume, By Ammonium sulfate, 2022 - 2032F |
6.1.7 Romania Inorganic Chemicals Market Revenues & Volume, By Inorganic acid, 2022 - 2032F |
6.1.8 Romania Inorganic Chemicals Market Revenues & Volume, By Sodium hydroxide, 2022 - 2032F |
6.1.9 Romania Inorganic Chemicals Market Revenues & Volume, By Oxygen, 2022 - 2032F |
6.1.10 Romania Inorganic Chemicals Market Revenues & Volume, By Oxygen, 2022 - 2032F |
7 Romania Inorganic Chemicals Market Import-Export Trade Statistics |
7.1 Romania Inorganic Chemicals Market Export to Major Countries |
7.2 Romania Inorganic Chemicals Market Imports from Major Countries |
8 Romania Inorganic Chemicals Market Key Performance Indicators |
8.1 Research and development expenditure for new inorganic chemical products. |
8.2 Number of new product launches in the inorganic chemicals market. |
8.3 Adoption rate of eco-friendly and sustainable inorganic chemical solutions in Romania. |
9 Romania Inorganic Chemicals Market - Opportunity Assessment |
9.1 Romania Inorganic Chemicals Market Opportunity Assessment, By Type, 2022 & 2032F |
10 Romania Inorganic Chemicals Market - Competitive Landscape |
10.1 Romania Inorganic Chemicals Market Revenue Share, By Companies, 2025 |
10.2 Romania Inorganic Chemicals Market Competitive Benchmarking, By Operating and Technical Parameters |
11 Company Profiles |
12 Recommendations |
13 Disclaimer |
Global Go To Market Strategy - 2030
Export potential enables firms to identify high-growth global markets with greater confidence by combining advanced trade intelligence with a structured quantitative methodology. The framework analyzes emerging demand trends and country-level import patterns while integrating macroeconomic and trade datasets such as GDP and population forecasts, bilateral import–export flows, tariff structures, elasticity differentials between developed and developing economies, geographic distance, and import demand projections. Using weighted trade values from 2020–2024 as the base period to project country-to-country export potential for 2030, these inputs are operationalized through calculated drivers such as gravity model parameters, tariff impact factors, and projected GDP per-capita growth. Through an analysis of hidden potentials, demand hotspots, and market conditions that are most favorable to success, this method enables firms to focus on target countries, maximize returns, and global expansion with data, backed by accuracy.
By factoring in the projected importer demand gap that is currently unmet and could be potential opportunity, it identifies the potential for the Exporter (Country) among 190 countries, against the general trade analysis, which identifies the biggest importer or exporter.
To discover high-growth global markets and optimize your business strategy:
Click Here
Pricing
- Single User License$ 1,995
- Department License$ 2,400
- Site License$ 3,120
- Global License$ 3,795

Leadership Perspectives from Industry Events
Search
Thought Leadership and Analyst Meet


Our Clients
6WResearch In News
- India Air Conditioner Market Set for Strong Rebound in 2026 After Weather-Led Correction and GST-Driven Recovery: 6Wresearch
- ADAS in India: How Automatic Emergency Braking, Blind Spot Detection & Driver Monitoring are Transforming Road Safety
- Doha a strategic location for EV manufacturing hub: IPA Qatar
- Demand for luxury TVs surging in the GCC, says Samsung
- Empowering Growth: The Thriving Journey of Bangladesh’s Cable Industry
- Demand for luxury TVs surging in the GCC, says Samsung
Latest Reports
- Nicaragua RPG Gaming Market (2026-2032)
- New Zealand RPG Gaming Market (2026-2032)
- Netherlands RPG Gaming Market (2026-2032)
- Nauru RPG Gaming Market (2026-2032)
- Namibia RPG Gaming Market (2026-2032)
- Mozambique RPG Gaming Market (2026-2032)
- Montenegro RPG Gaming Market (2026-2032)
- Mongolia RPG Gaming Market (2026-2032)
- Monaco RPG Gaming Market (2026-2032)
- Micronesia RPG Gaming Market (2026-2032)
Industry Events and Analyst Meet

EV India Expo 2026

HIMTEX 2026

India Refining Summit 2026

India EV Show 2026

EV tech India Expo 2026
Whitepaper
- Middle East & Africa Commercial Security Market Click here to view more.
- Middle East & Africa Fire Safety Systems & Equipment Market Click here to view more.
- GCC Drone Market Click here to view more.
- Middle East Lighting Fixture Market Click here to view more.
- GCC Physical & Perimeter Security Market Click here to view more.