Saudi Arabia Cryogenic Pump Market (2026-2032) Outlook | Analysis, Forecast, Growth, Revenue, Trends, Industry, Size, Value, Share & Companies
Market Forecast By Design (Submersible, Non-Submersible), By Cryogen (Nitrogen, Argon, Oxygen, LNG, Helium, Hydrogen), By End User (Energy & Power, Chemicals, Metallurgy, Healthcare & Pharmaceuticals) And Competitive Landscape
| Product Code: ETC4527520 | Publication Date: Jul 2023 | Updated Date: Mar 2026 | Product Type: Report | |
| Publisher: 6Wresearch | Author: Ravi Bhandari | No. of Pages: 85 | No. of Figures: 45 | No. of Tables: 25 |
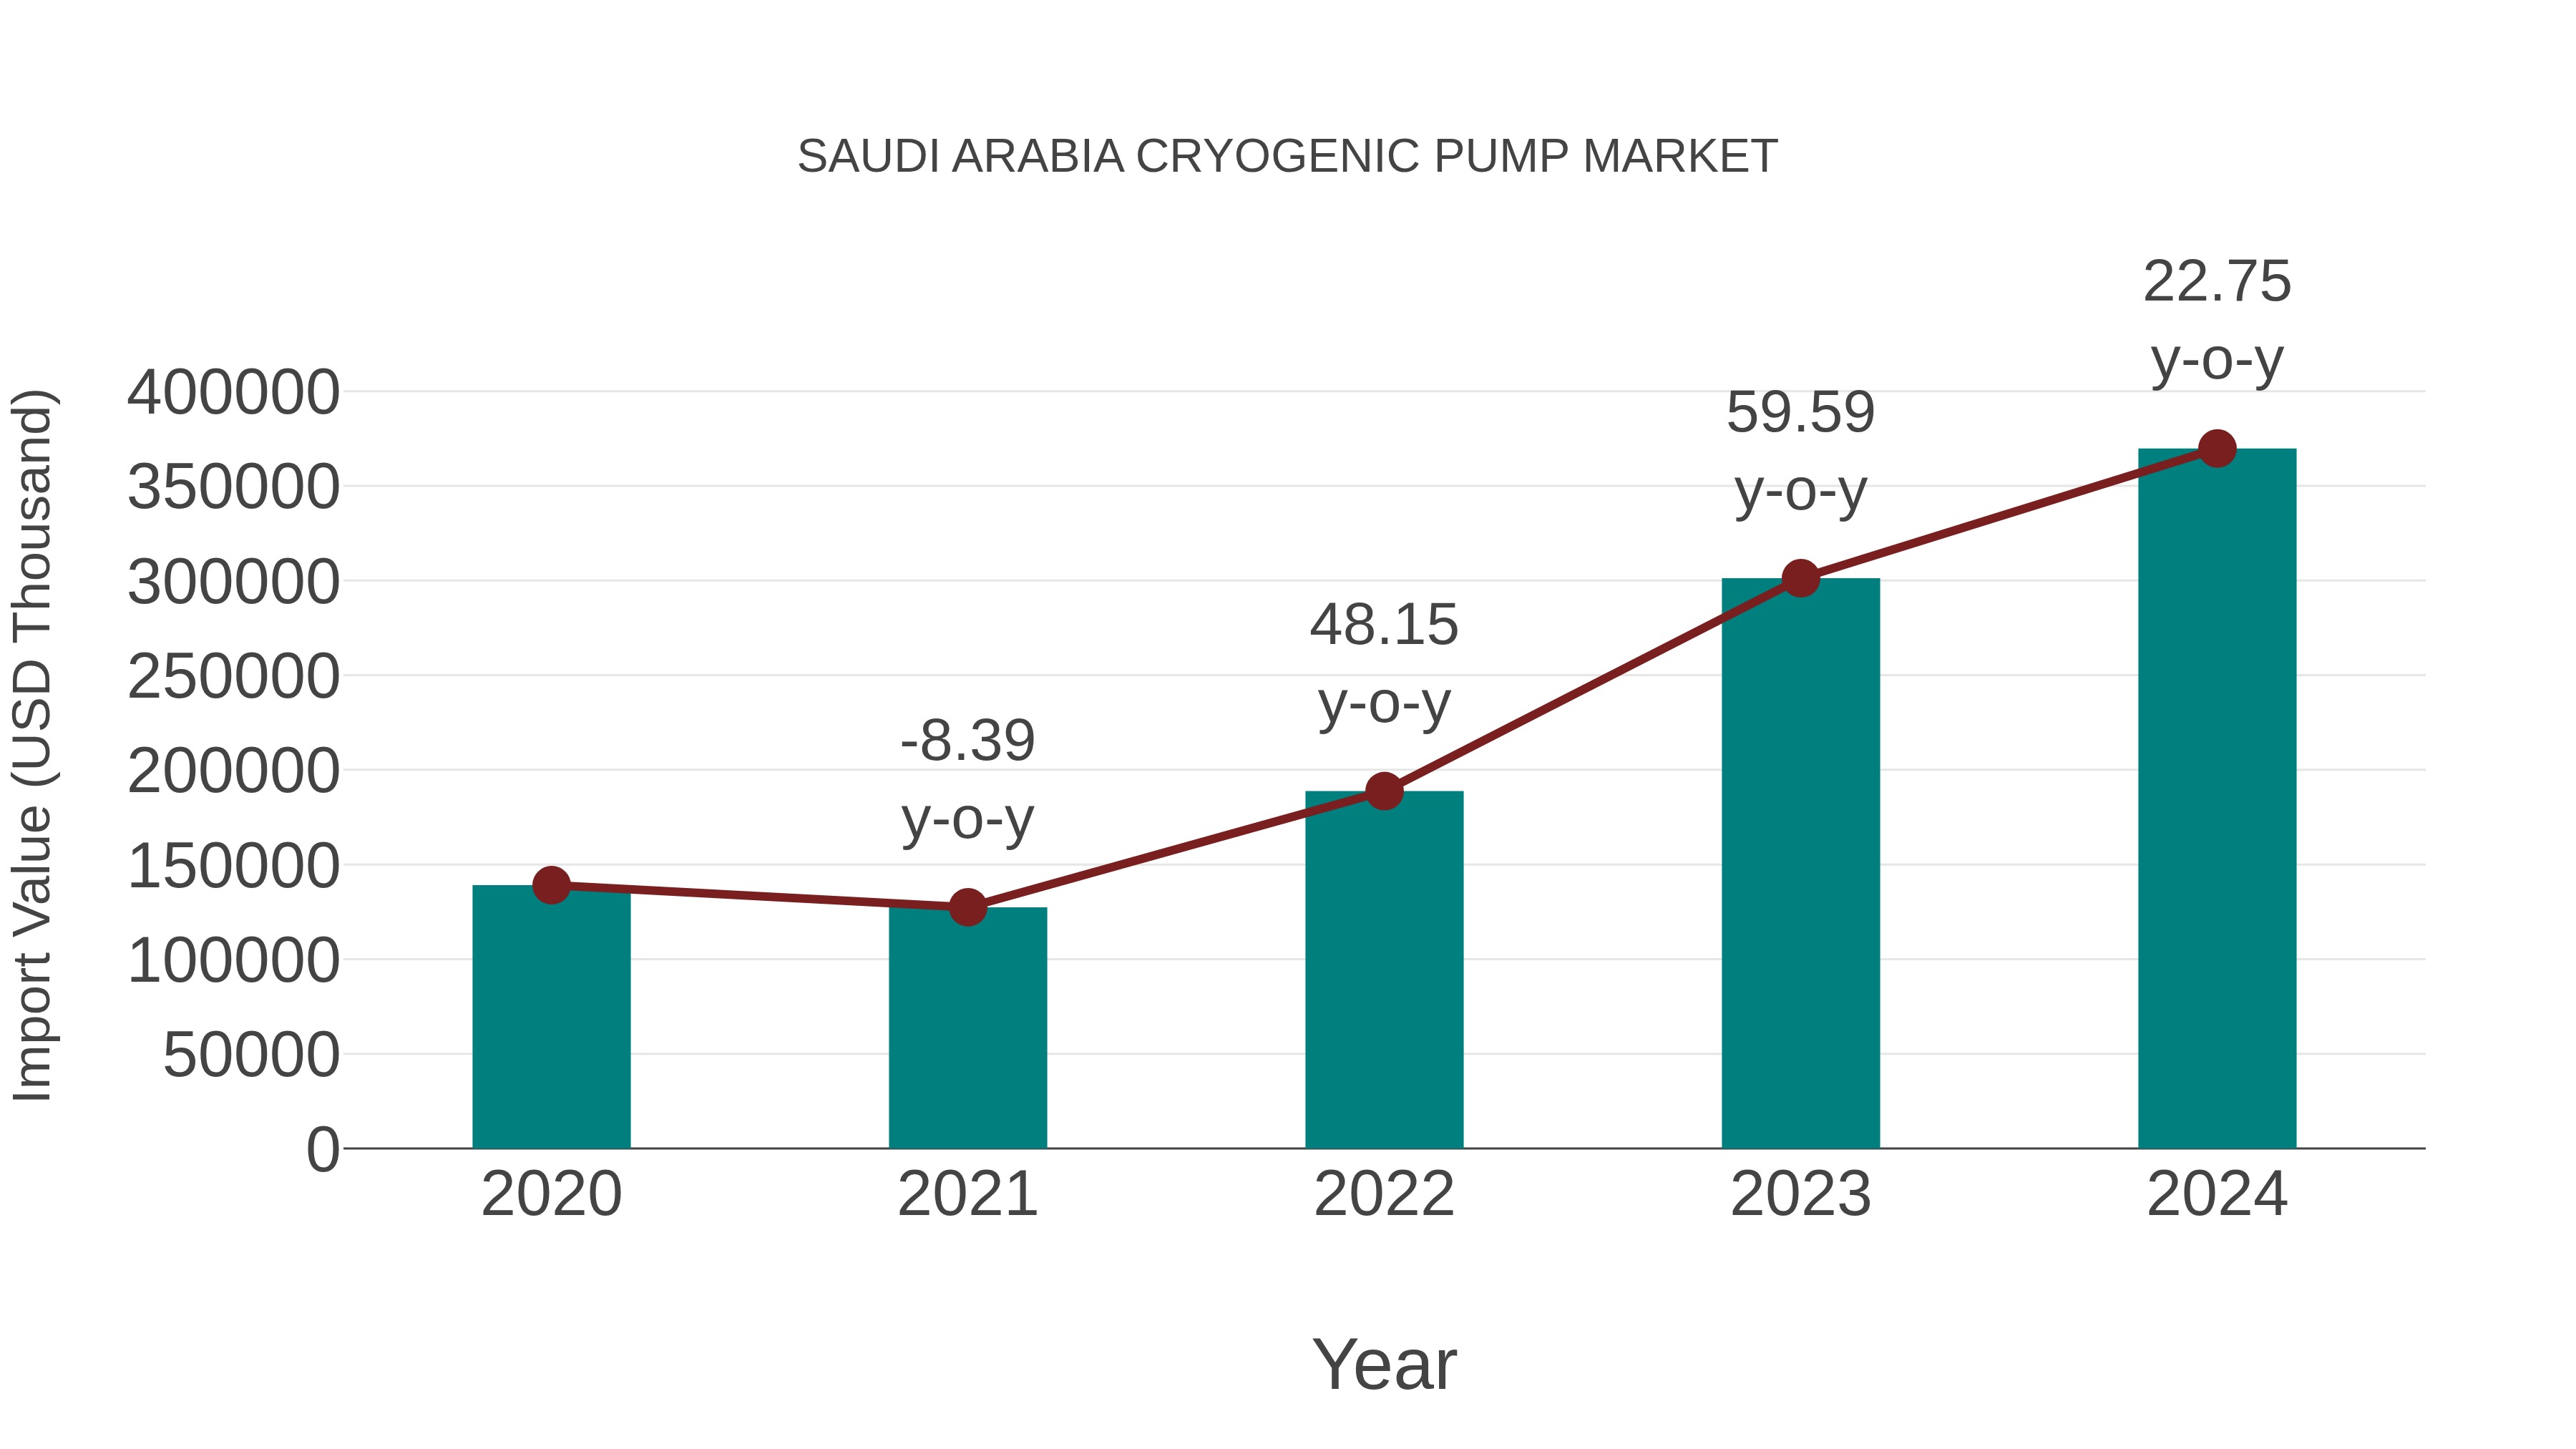
Saudi Arabia Cryogenic Pump Market: Import Trend Analysis
In the Saudi Arabia cryogenic pump market, the import trend exhibited significant growth, with a 22.75% increase from 2023 to 2024. The compound annual growth rate (CAGR) for imports from 2020 to 2024 stood at 27.69%. This surge can be attributed to the expanding industrial sector and increased demand for cryogenic equipment in the country.
Saudi Arabia Cryogenic Pump Market Overview
Cryogenic pumps are crucial for handling extremely low-temperature fluids, such as liquefied gases. In Saudi Arabia, this market covers the manufacturing and deployment of cryogenic pumps in applications like gas liquefaction.
Drivers of the Market
The cryogenic pump market is witnessing growth as industries in Saudi Arabia require pumps for handling extremely low-temperature fluids, such as liquefied natural gas (LNG) and industrial gases. Cryogenic pumps ensure safe and efficient transfer of cryogenic fluids. With the growth of the energy and industrial gas sectors, the demand for cryogenic pumps is on the rise.
Challenges of the Market
The cryogenic pump market in Saudi Arabia confronts challenges linked to the efficient handling of cryogenic fluids, addressing extreme temperature conditions and the need for specialized materials and technology.
COVID-19 Impact on the Market
The Cryogenic Pump market in Saudi Arabia, vital for low-temperature applications, faced challenges during the pandemic, including supply chain disruptions and project delays. Nevertheless, as industries focus on cryogenic applications, the market is on the path to recovery.
Key Players in the Market
Key companies in the Saudi Arabia cryogenic pump market include Chart Industries, Inc., Linde plc, and Nikkiso Co., Ltd., providing cryogenic pumps for applications like LNG.
Key Highlights of the Report:
- Saudi Arabia Cryogenic Pump Market Outlook
- Market Size of Saudi Arabia Cryogenic Pump Market, 2025
- Forecast of Saudi Arabia Cryogenic Pump Market, 2032
- Historical Data and Forecast of Saudi Arabia Cryogenic Pump Revenues & Volume for the Period 2022-2032F
- Saudi Arabia Cryogenic Pump Market Trend Evolution
- Saudi Arabia Cryogenic Pump Market Drivers and Challenges
- Saudi Arabia Cryogenic Pump Price Trends
- Saudi Arabia Cryogenic Pump Porter's Five Forces
- Saudi Arabia Cryogenic Pump Industry Life Cycle
- Historical Data and Forecast of Saudi Arabia Cryogenic Pump Market Revenues & Volume By Design for the Period 2022-2032F
- Historical Data and Forecast of Saudi Arabia Cryogenic Pump Market Revenues & Volume By Submersible for the Period 2022-2032F
- Historical Data and Forecast of Saudi Arabia Cryogenic Pump Market Revenues & Volume By Non-Submersible for the Period 2022-2032F
- Historical Data and Forecast of Saudi Arabia Cryogenic Pump Market Revenues & Volume By Cryogen for the Period 2022-2032F
- Historical Data and Forecast of Saudi Arabia Cryogenic Pump Market Revenues & Volume By Nitrogen for the Period 2022-2032F
- Historical Data and Forecast of Saudi Arabia Cryogenic Pump Market Revenues & Volume By Argon for the Period 2022-2032F
- Historical Data and Forecast of Saudi Arabia Cryogenic Pump Market Revenues & Volume By Oxygen for the Period 2022-2032F
- Historical Data and Forecast of Saudi Arabia Cryogenic Pump Market Revenues & Volume By LNG for the Period 2022-2032F
- Historical Data and Forecast of Saudi Arabia Cryogenic Pump Market Revenues & Volume By Helium for the Period 2022-2032F
- Historical Data and Forecast of Saudi Arabia Cryogenic Pump Market Revenues & Volume By Hydrogen for the Period 2022-2032F
- Historical Data and Forecast of Saudi Arabia Cryogenic Pump Market Revenues & Volume By End User for the Period 2022-2032F
- Historical Data and Forecast of Saudi Arabia Cryogenic Pump Market Revenues & Volume By Energy & Power for the Period 2022-2032F
- Historical Data and Forecast of Saudi Arabia Cryogenic Pump Market Revenues & Volume By Chemicals for the Period 2022-2032F
- Historical Data and Forecast of Saudi Arabia Cryogenic Pump Market Revenues & Volume By Metallurgy for the Period 2022-2032F
- Historical Data and Forecast of Saudi Arabia Cryogenic Pump Market Revenues & Volume By Healthcare & Pharmaceuticals for the Period 2022-2032F
- Saudi Arabia Cryogenic Pump Import Export Trade Statistics
- Market Opportunity Assessment By Design
- Market Opportunity Assessment By Cryogen
- Market Opportunity Assessment By End User
- Saudi Arabia Cryogenic Pump Top Companies Market Share
- Saudi Arabia Cryogenic Pump Competitive Benchmarking By Technical and Operational Parameters
- Saudi Arabia Cryogenic Pump Company Profiles
- Saudi Arabia Cryogenic Pump Key Strategic Recommendations
Saudi Arabia Cryogenic Pump Market (2026-2032): FAQs
6Wresearch actively monitors the Saudi Arabia Cryogenic Pump Market and publishes its comprehensive annual report, highlighting emerging trends, growth drivers, revenue analysis, and forecast outlook. Our insights help businesses to make data-backed strategic decisions with ongoing market dynamics. Our analysts track relevent industries related to the Saudi Arabia Cryogenic Pump Market, allowing our clients with actionable intelligence and reliable forecasts tailored to emerging regional needs.
Yes, we provide customisation as per your requirements. To learn more, feel free to contact us on sales@6wresearch.com
1 Executive Summary |
2 Introduction |
2.1 Key Highlights of the Report |
2.2 Report Description |
2.3 Market Scope & Segmentation |
2.4 Research Methodology |
2.5 Assumptions |
3 Saudi Arabia Cryogenic Pump Market Overview |
3.1 Saudi Arabia Country Macro Economic Indicators |
3.2 Saudi Arabia Cryogenic Pump Market Revenues & Volume, 2022 & 2032F |
3.3 Saudi Arabia Cryogenic Pump Market - Industry Life Cycle |
3.4 Saudi Arabia Cryogenic Pump Market - Porter's Five Forces |
3.5 Saudi Arabia Cryogenic Pump Market Revenues & Volume Share, By Design, 2022 & 2032F |
3.6 Saudi Arabia Cryogenic Pump Market Revenues & Volume Share, By Cryogen, 2022 & 2032F |
3.7 Saudi Arabia Cryogenic Pump Market Revenues & Volume Share, By End User, 2022 & 2032F |
4 Saudi Arabia Cryogenic Pump Market Dynamics |
4.1 Impact Analysis |
4.2 Market Drivers |
4.2.1 Growing demand for liquefied natural gas (LNG) in Saudi Arabia |
4.2.2 Increasing adoption of cryogenic pumps in healthcare, food processing, and metal fabrication industries |
4.2.3 Rise in investments in infrastructure projects and industrial applications |
4.3 Market Restraints |
4.3.1 High initial investment cost for cryogenic pump systems |
4.3.2 Technological complexities and maintenance requirements |
4.3.3 Stringent regulations and safety standards in handling cryogenic materials |
5 Saudi Arabia Cryogenic Pump Market Trends |
6 Saudi Arabia Cryogenic Pump Market, By Types |
6.1 Saudi Arabia Cryogenic Pump Market, By Design |
6.1.1 Overview and Analysis |
6.1.2 Saudi Arabia Cryogenic Pump Market Revenues & Volume, By Design, 2022-2032F |
6.1.3 Saudi Arabia Cryogenic Pump Market Revenues & Volume, By Submersible, 2022-2032F |
6.1.4 Saudi Arabia Cryogenic Pump Market Revenues & Volume, By Non-Submersible, 2022-2032F |
6.2 Saudi Arabia Cryogenic Pump Market, By Cryogen |
6.2.1 Overview and Analysis |
6.2.2 Saudi Arabia Cryogenic Pump Market Revenues & Volume, By Nitrogen, 2022-2032F |
6.2.3 Saudi Arabia Cryogenic Pump Market Revenues & Volume, By Argon, 2022-2032F |
6.2.4 Saudi Arabia Cryogenic Pump Market Revenues & Volume, By Oxygen, 2022-2032F |
6.2.5 Saudi Arabia Cryogenic Pump Market Revenues & Volume, By LNG, 2022-2032F |
6.2.6 Saudi Arabia Cryogenic Pump Market Revenues & Volume, By Helium, 2022-2032F |
6.2.7 Saudi Arabia Cryogenic Pump Market Revenues & Volume, By Hydrogen, 2022-2032F |
6.3 Saudi Arabia Cryogenic Pump Market, By End User |
6.3.1 Overview and Analysis |
6.3.2 Saudi Arabia Cryogenic Pump Market Revenues & Volume, By Energy & Power, 2022-2032F |
6.3.3 Saudi Arabia Cryogenic Pump Market Revenues & Volume, By Chemicals, 2022-2032F |
6.3.4 Saudi Arabia Cryogenic Pump Market Revenues & Volume, By Metallurgy, 2022-2032F |
6.3.5 Saudi Arabia Cryogenic Pump Market Revenues & Volume, By Healthcare & Pharmaceuticals, 2022-2032F |
7 Saudi Arabia Cryogenic Pump Market Import-Export Trade Statistics |
7.1 Saudi Arabia Cryogenic Pump Market Export to Major Countries |
7.2 Saudi Arabia Cryogenic Pump Market Imports from Major Countries |
8 Saudi Arabia Cryogenic Pump Market Key Performance Indicators |
8.1 Energy efficiency of cryogenic pumps |
8.2 Percentage of uptime and reliability of cryogenic pump systems |
8.3 Adoption rate of cryogenic pump technology in new industries |
9 Saudi Arabia Cryogenic Pump Market - Opportunity Assessment |
9.1 Saudi Arabia Cryogenic Pump Market Opportunity Assessment, By Design, 2022 & 2032F |
9.2 Saudi Arabia Cryogenic Pump Market Opportunity Assessment, By Cryogen, 2022 & 2032F |
9.3 Saudi Arabia Cryogenic Pump Market Opportunity Assessment, By End User, 2022 & 2032F |
10 Saudi Arabia Cryogenic Pump Market - Competitive Landscape |
10.1 Saudi Arabia Cryogenic Pump Market Revenue Share, By Companies, 2025 |
10.2 Saudi Arabia Cryogenic Pump Market Competitive Benchmarking, By Operating and Technical Parameters |
11 Company Profiles |
12 Recommendations |
13 Disclaimer |
Global Go To Market Strategy - 2030
Export potential enables firms to identify high-growth global markets with greater confidence by combining advanced trade intelligence with a structured quantitative methodology. The framework analyzes emerging demand trends and country-level import patterns while integrating macroeconomic and trade datasets such as GDP and population forecasts, bilateral import–export flows, tariff structures, elasticity differentials between developed and developing economies, geographic distance, and import demand projections. Using weighted trade values from 2020–2024 as the base period to project country-to-country export potential for 2030, these inputs are operationalized through calculated drivers such as gravity model parameters, tariff impact factors, and projected GDP per-capita growth. Through an analysis of hidden potentials, demand hotspots, and market conditions that are most favorable to success, this method enables firms to focus on target countries, maximize returns, and global expansion with data, backed by accuracy.
By factoring in the projected importer demand gap that is currently unmet and could be potential opportunity, it identifies the potential for the Exporter (Country) among 190 countries, against the general trade analysis, which identifies the biggest importer or exporter.
To discover high-growth global markets and optimize your business strategy:
Click Here
Pricing
- Single User License$ 1,995
- Department License$ 2,400
- Site License$ 3,120
- Global License$ 3,795

Leadership Perspectives from Industry Events
Search
Thought Leadership and Analyst Meet


Our Clients
6WResearch In News
- India Air Conditioner Market Set for Strong Rebound in 2026 After Weather-Led Correction and GST-Driven Recovery: 6Wresearch
- ADAS in India: How Automatic Emergency Braking, Blind Spot Detection & Driver Monitoring are Transforming Road Safety
- Doha a strategic location for EV manufacturing hub: IPA Qatar
- Demand for luxury TVs surging in the GCC, says Samsung
- Empowering Growth: The Thriving Journey of Bangladesh’s Cable Industry
- Demand for luxury TVs surging in the GCC, says Samsung
Latest Reports
- Poland Fire Protection Systems Market (2026-2032)
- Cape Verde Portable Hand-Thrown Extinguisher Market (2026-2032)
- Canada Portable Hand-Thrown Extinguisher Market (2026-2032)
- Cameroon Portable Hand-Thrown Extinguisher Market (2026-2032)
- Burundi Portable Hand-Thrown Extinguisher Market (2026-2032)
- Burkina Faso Portable Hand-Thrown Extinguisher Market (2026-2032)
- Bulgaria Portable Hand-Thrown Extinguisher Market (2026-2032)
- Brunei Portable Hand-Thrown Extinguisher Market (2026-2032)
- Botswana Portable Hand-Thrown Extinguisher Market (2026-2032)
- Bosnia and Herzegovina Portable Hand-Thrown Extinguisher Market (2026-2032)
Industry Events and Analyst Meet

HIMTEX 2026

India Refining Summit 2026

India EV Show 2026

EV tech India Expo 2026

Auto Tech Asia 2026
Whitepaper
- Middle East & Africa Commercial Security Market Click here to view more.
- Middle East & Africa Fire Safety Systems & Equipment Market Click here to view more.
- GCC Drone Market Click here to view more.
- Middle East Lighting Fixture Market Click here to view more.
- GCC Physical & Perimeter Security Market Click here to view more.