Slovenia Edible Oil Market (2026-2032) | Industry, Share, Companies, Analysis, Segmentation, Trends, Outlook, Growth, Revenue, Size, Forecast & Value
Market Forecast By Type (Palm Oil, Soybean Oil, Mustard Oil, Sunflower Oil, Others, ), By Packaging Type (Pouches, Jars, Cans, Bottles, ), By Pack Size (Less than 1 Litres, 1 Litres, 1 Litres - 5 litres, 5 Litres - 10 Litres, 10 Litres and Above, ), By Packaging Material (Metal, Plastic, Paper, Others), By Application (HoReCa, Home Users, Food Processing Industry, ), By Distribution Channel (Direct/Institutional Sales, Supermarkets and Hypermarkets, Convenience Stores, Online, Others) And Competitive Landscape
| Product Code: ETC5013935 | Publication Date: Nov 2023 | Updated Date: Apr 2026 | Product Type: Market Research Report | |
| Publisher: 6Wresearch | Author: Shubham Padhi | No. of Pages: 60 | No. of Figures: 30 | No. of Tables: 5 |
Slovenia Edible Oil Market Size (2020-2030)
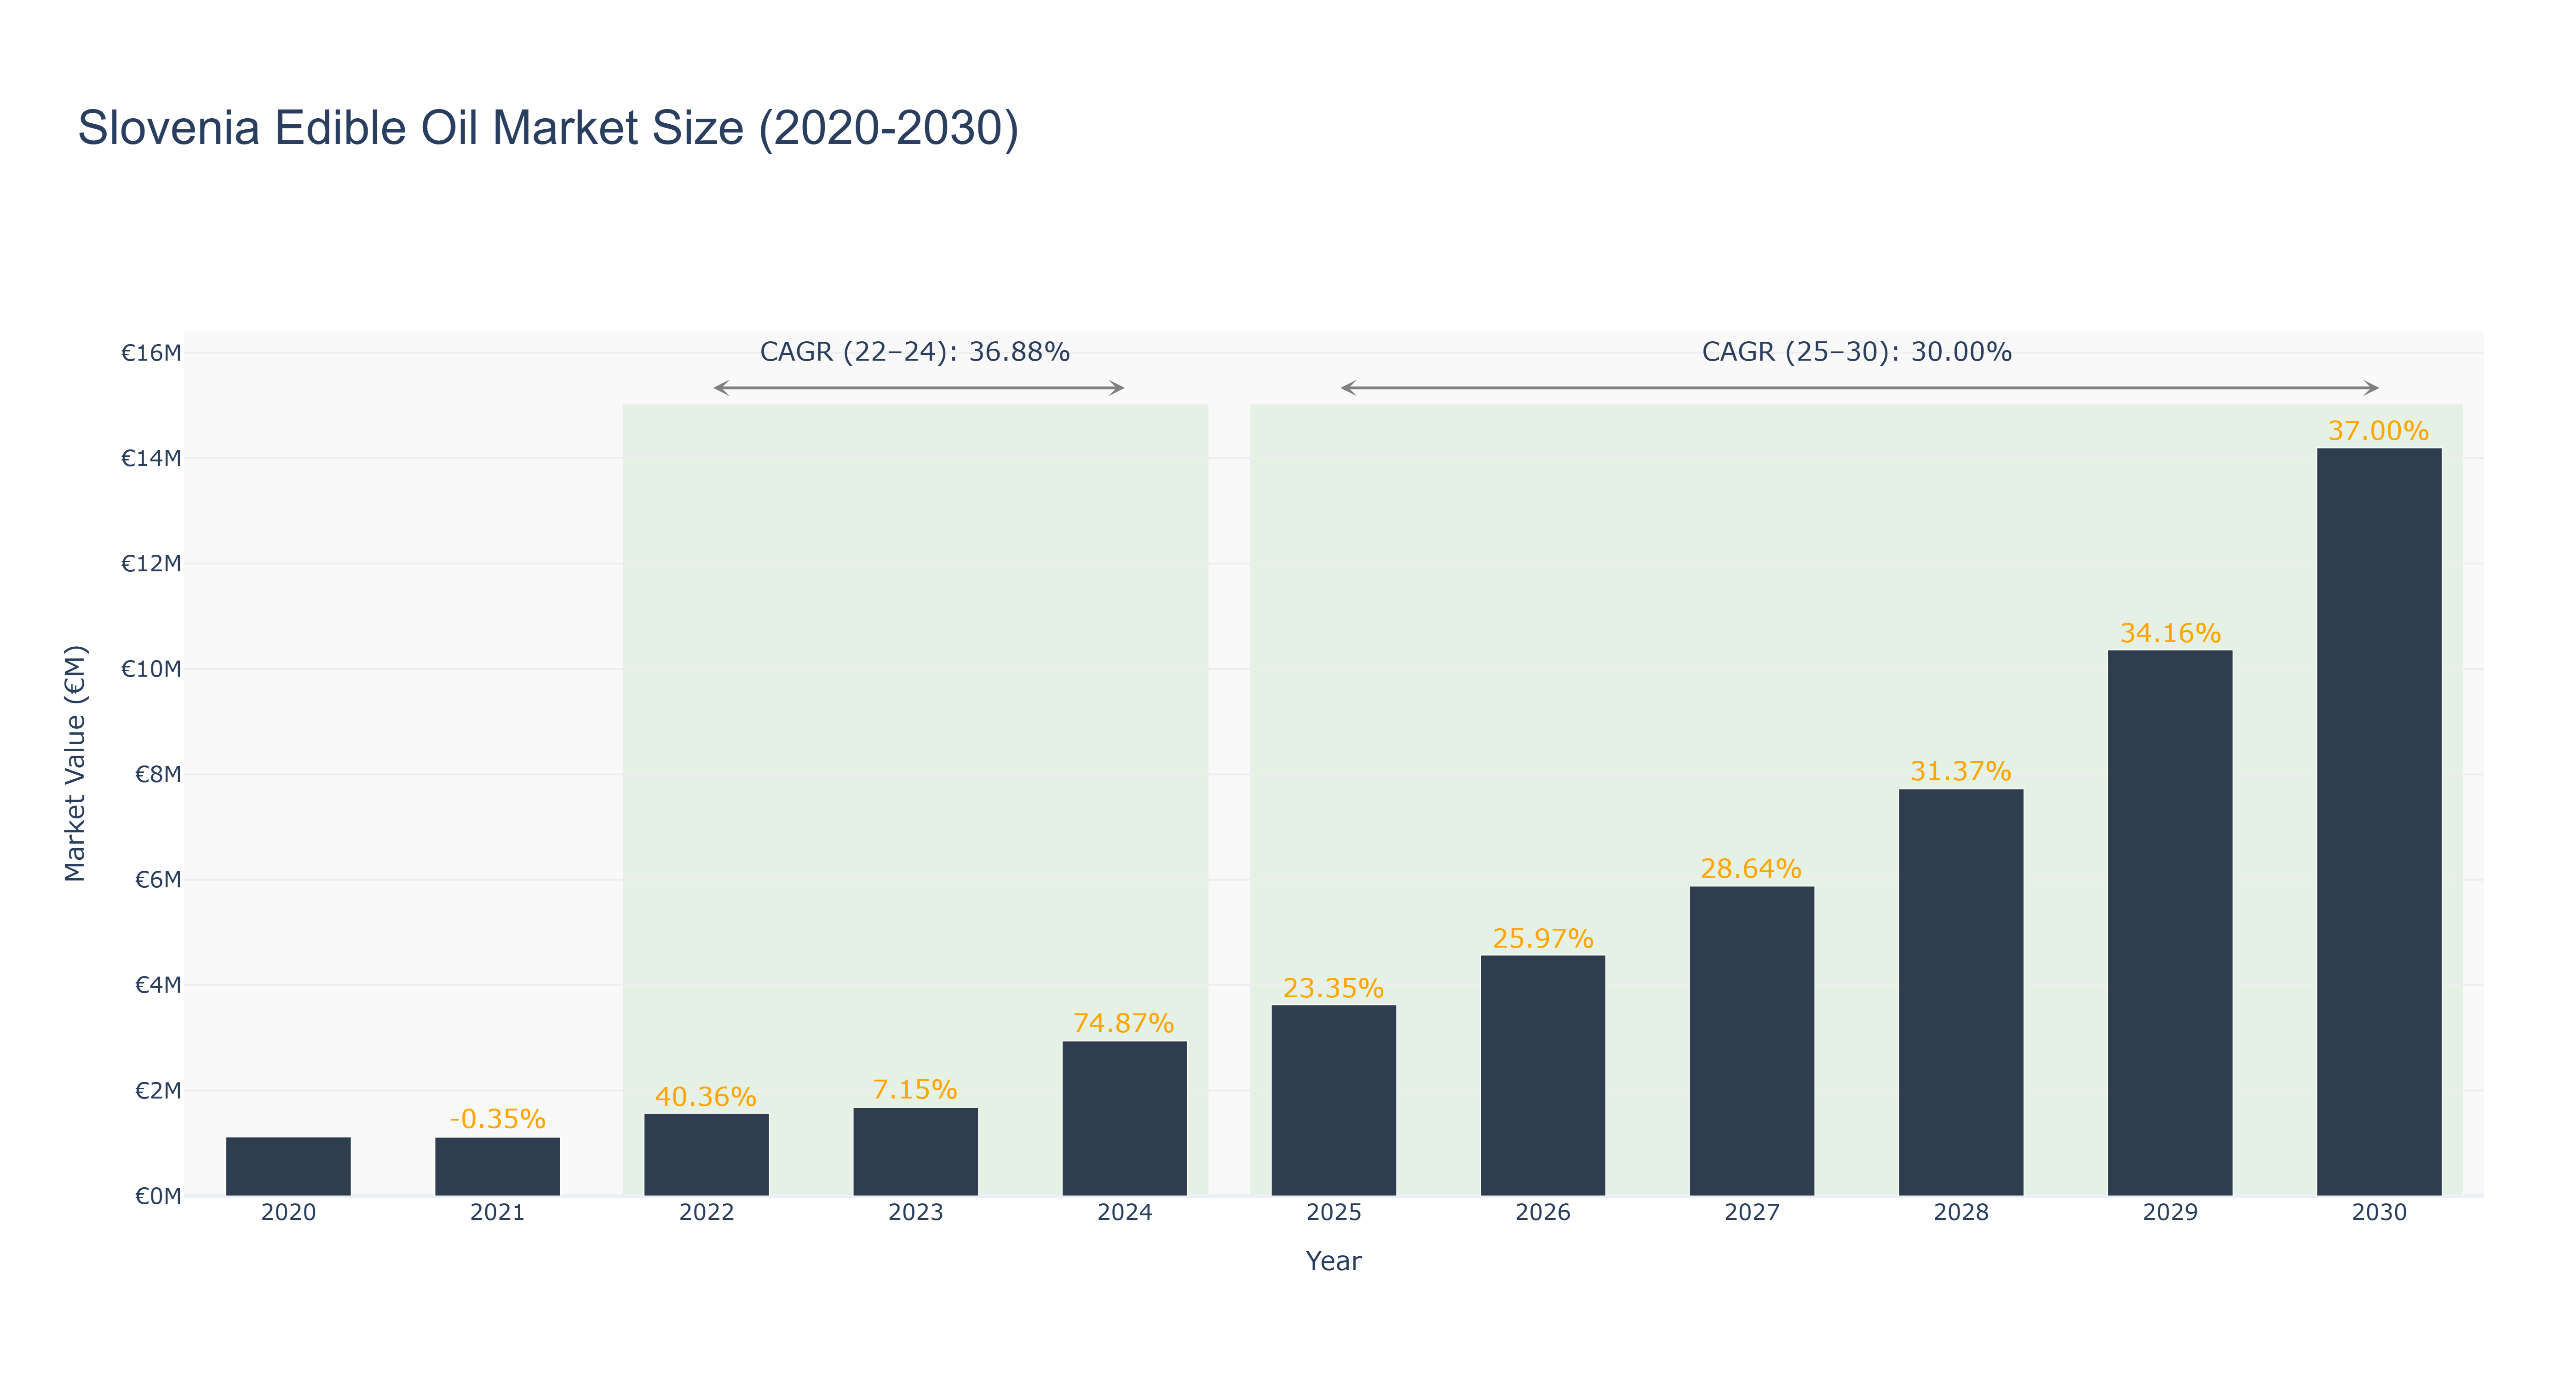
Slovenia Edible Oil Market has shown a remarkable growth trajectory over the years. The market peaked at €14.20 million in 2030, with a forecasted CAGR of 30.0% from 2025 to 2030, indicating sustained growth. The actual market size increased steadily from €1.12 million in 2020 to €2.94 million in 2024, driven by increasing consumer demand for healthier cooking oils. The significant spike in market size in 2024 can be attributed to a surge in health-conscious consumption patterns and promotional activities by key market players. Moving forward, the market is poised for further expansion, with upcoming investments in sustainable production processes and innovative product offerings to meet evolving consumer preferences. These developments are expected to drive continued growth in the Slovenia Edible Oil Market, making it a lucrative sector for investment and market expansion.
Slovenia Edible Oil Market: Production & Trade Performance (2019-2025)
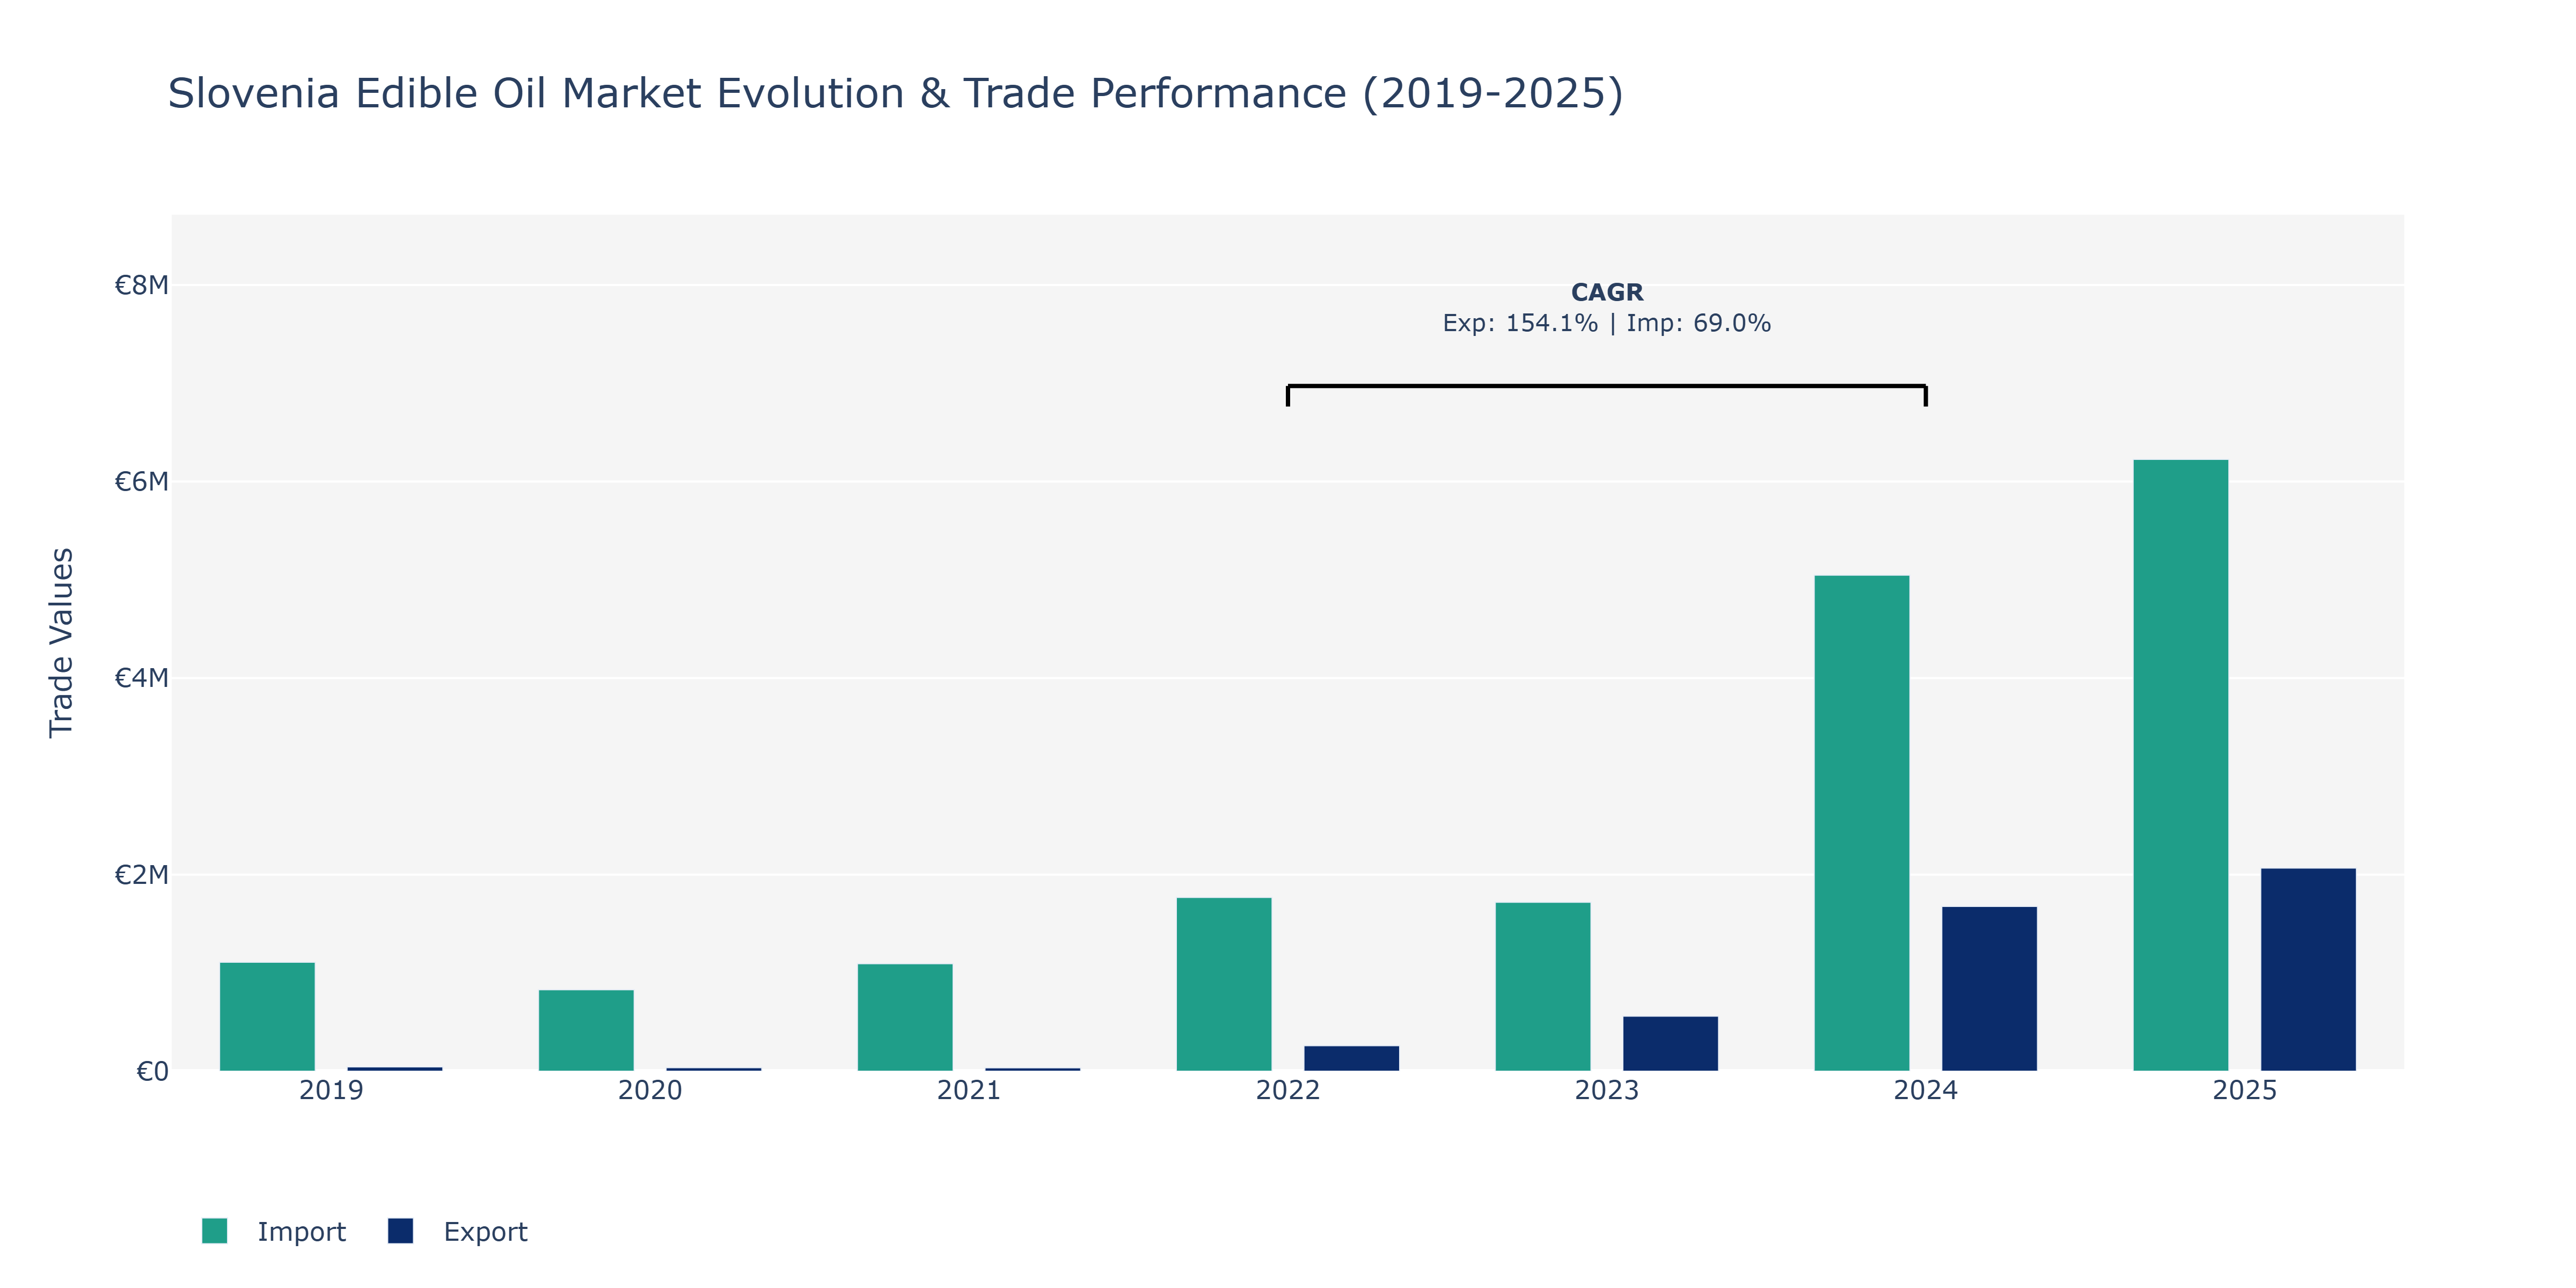
The Slovenia Edible Oil Market witnessed notable fluctuations in both Exports and Imports from 2019 to 2025. Exports started at €43.94 thousand in 2019, experienced a sharp decline in 2020 to €34.88 thousand, and then surged significantly in the following years, reaching €2.07 million in 2025. Meanwhile, Imports began at €1.11 million in 2019, decreased in 2020 to €828.14 thousand, and then showed fluctuating patterns, peaking at €5.05 million in 2024 before slightly decreasing to €6.23 million in 2025. The substantial growth in Exports can be attributed to the increased global demand for high-quality edible oils, especially with Slovenia known for its premium products. On the other hand, the surge in Imports could be influenced by shifts in consumer preferences towards diverse oil varieties not domestically produced, indicating a growing market for international edible oil brands within Slovenia.
Key Highlights of the Report:
- Slovenia Edible Oil Market Outlook
- Market Size of Slovenia Edible Oil Market, 2025
- Forecast of Slovenia Edible Oil Market, 2032
- Historical Data and Forecast of Slovenia Edible Oil Revenues & Volume for the Period 2022-2032F
- Slovenia Edible Oil Market Trend Evolution
- Slovenia Edible Oil Market Drivers and Challenges
- Slovenia Edible Oil Price Trends
- Slovenia Edible Oil Porter`s Five Forces
- Slovenia Edible Oil Industry Life Cycle
- Historical Data and Forecast of Slovenia Edible Oil Market Revenues & Volume By Type for the Period 2022-2032F
- Historical Data and Forecast of Slovenia Edible Oil Market Revenues & Volume By Palm Oil for the Period 2022-2032F
- Historical Data and Forecast of Slovenia Edible Oil Market Revenues & Volume By Soybean Oil for the Period 2022-2032F
- Historical Data and Forecast of Slovenia Edible Oil Market Revenues & Volume By Mustard Oil for the Period 2022-2032F
- Historical Data and Forecast of Slovenia Edible Oil Market Revenues & Volume By Sunflower Oil for the Period 2022-2032F
- Historical Data and Forecast of Slovenia Edible Oil Market Revenues & Volume By Others for the Period 2022-2032F
- Historical Data and Forecast of Slovenia Edible Oil Market Revenues & Volume By for the Period 2022-2032F
- Historical Data and Forecast of Slovenia Edible Oil Market Revenues & Volume By Packaging Type for the Period 2022-2032F
- Historical Data and Forecast of Slovenia Edible Oil Market Revenues & Volume By Pouches for the Period 2022-2032F
- Historical Data and Forecast of Slovenia Edible Oil Market Revenues & Volume By Jars for the Period 2022-2032F
- Historical Data and Forecast of Slovenia Edible Oil Market Revenues & Volume By Cans for the Period 2022-2032F
- Historical Data and Forecast of Slovenia Edible Oil Market Revenues & Volume By Bottles for the Period 2022-2032F
- Historical Data and Forecast of Slovenia Edible Oil Market Revenues & Volume By for the Period 2022-2032F
- Historical Data and Forecast of Slovenia Edible Oil Market Revenues & Volume By Pack Size for the Period 2022-2032F
- Historical Data and Forecast of Slovenia Edible Oil Market Revenues & Volume By Less than 1 Litres for the Period 2022-2032F
- Historical Data and Forecast of Slovenia Edible Oil Market Revenues & Volume By 1 Litres for the Period 2022-2032F
- Historical Data and Forecast of Slovenia Edible Oil Market Revenues & Volume By 1 Litres - 5 litres for the Period 2022-2032F
- Historical Data and Forecast of Slovenia Edible Oil Market Revenues & Volume By 5 Litres - 10 Litres for the Period 2022-2032F
- Historical Data and Forecast of Slovenia Edible Oil Market Revenues & Volume By 10 Litres and Above for the Period 2022-2032F
- Historical Data and Forecast of Slovenia Edible Oil Market Revenues & Volume By for the Period 2022-2032F
- Historical Data and Forecast of Slovenia Edible Oil Market Revenues & Volume By Packaging Material for the Period 2022-2032F
- Historical Data and Forecast of Slovenia Edible Oil Market Revenues & Volume By Metal for the Period 2022-2032F
- Historical Data and Forecast of Slovenia Edible Oil Market Revenues & Volume By Plastic for the Period 2022-2032F
- Historical Data and Forecast of Slovenia Edible Oil Market Revenues & Volume By Paper for the Period 2022-2032F
- Historical Data and Forecast of Slovenia Edible Oil Market Revenues & Volume By Others for the Period 2022-2032F
- Historical Data and Forecast of Slovenia Edible Oil Market Revenues & Volume By Application for the Period 2022-2032F
- Historical Data and Forecast of Slovenia Edible Oil Market Revenues & Volume By HoReCa for the Period 2022-2032F
- Historical Data and Forecast of Slovenia Edible Oil Market Revenues & Volume By Home Users for the Period 2022-2032F
- Historical Data and Forecast of Slovenia Edible Oil Market Revenues & Volume By Food Processing Industry for the Period 2022-2032F
- Historical Data and Forecast of Slovenia Edible Oil Market Revenues & Volume By for the Period 2022-2032F
- Historical Data and Forecast of Slovenia Edible Oil Market Revenues & Volume By Distribution Channel for the Period 2022-2032F
- Historical Data and Forecast of Slovenia Edible Oil Market Revenues & Volume By Direct/Institutional Sales for the Period 2022-2032F
- Historical Data and Forecast of Slovenia Edible Oil Market Revenues & Volume By Supermarkets and Hypermarkets for the Period 2022-2032F
- Historical Data and Forecast of Slovenia Edible Oil Market Revenues & Volume By Convenience Stores for the Period 2022-2032F
- Historical Data and Forecast of Slovenia Edible Oil Market Revenues & Volume By Online for the Period 2022-2032F
- Historical Data and Forecast of Slovenia Edible Oil Market Revenues & Volume By Others for the Period 2022-2032F
- Slovenia Edible Oil Import Export Trade Statistics
- Market Opportunity Assessment By Type
- Market Opportunity Assessment By Packaging Type
- Market Opportunity Assessment By Pack Size
- Market Opportunity Assessment By Packaging Material
- Market Opportunity Assessment By Application
- Market Opportunity Assessment By Distribution Channel
- Slovenia Edible Oil Top Companies Market Share
- Slovenia Edible Oil Competitive Benchmarking By Technical and Operational Parameters
- Slovenia Edible Oil Company Profiles
- Slovenia Edible Oil Key Strategic Recommendations
Frequently Asked Questions About the Market Study (FAQs):
6Wresearch actively monitors the Slovenia Edible Oil Market and publishes its comprehensive annual report, highlighting emerging trends, growth drivers, revenue analysis, and forecast outlook. Our insights help businesses to make data-backed strategic decisions with ongoing market dynamics. Our analysts track relevent industries related to the Slovenia Edible Oil Market, allowing our clients with actionable intelligence and reliable forecasts tailored to emerging regional needs.
Yes, we provide customisation as per your requirements. To learn more, feel free to contact us on sales@6wresearch.com
1 Executive Summary |
2 Introduction |
2.1 Key Highlights of the Report |
2.2 Report Description |
2.3 Market Scope & Segmentation |
2.4 Research Methodology |
2.5 Assumptions |
3 Slovenia Edible Oil Market Overview |
3.1 Slovenia Country Macro Economic Indicators |
3.2 Slovenia Edible Oil Market Revenues & Volume, 2022 & 2032F |
3.3 Slovenia Edible Oil Market - Industry Life Cycle |
3.4 Slovenia Edible Oil Market - Porter's Five Forces |
3.5 Slovenia Edible Oil Market Revenues & Volume Share, By Type, 2022 & 2032F |
3.6 Slovenia Edible Oil Market Revenues & Volume Share, By Packaging Type, 2022 & 2032F |
3.7 Slovenia Edible Oil Market Revenues & Volume Share, By Pack Size, 2022 & 2032F |
3.8 Slovenia Edible Oil Market Revenues & Volume Share, By Packaging Material, 2022 & 2032F |
3.9 Slovenia Edible Oil Market Revenues & Volume Share, By Application, 2022 & 2032F |
3.10 Slovenia Edible Oil Market Revenues & Volume Share, By Distribution Channel, 2022 & 2032F |
4 Slovenia Edible Oil Market Dynamics |
4.1 Impact Analysis |
4.2 Market Drivers |
4.2.1 Increasing awareness about the health benefits of using edible oils |
4.2.2 Growing demand for organic and natural edible oils |
4.2.3 Rising disposable income leading to higher consumption of premium edible oils |
4.3 Market Restraints |
4.3.1 Fluctuations in raw material prices impacting production costs |
4.3.2 Stringent government regulations related to food safety and quality standards |
5 Slovenia Edible Oil Market Trends |
6 Slovenia Edible Oil Market Segmentations |
6.1 Slovenia Edible Oil Market, By Type |
6.1.1 Overview and Analysis |
6.1.2 Slovenia Edible Oil Market Revenues & Volume, By Palm Oil, 2022-2032F |
6.1.3 Slovenia Edible Oil Market Revenues & Volume, By Soybean Oil, 2022-2032F |
6.1.4 Slovenia Edible Oil Market Revenues & Volume, By Mustard Oil, 2022-2032F |
6.1.5 Slovenia Edible Oil Market Revenues & Volume, By Sunflower Oil, 2022-2032F |
6.1.6 Slovenia Edible Oil Market Revenues & Volume, By Others, 2022-2032F |
6.1.7 Slovenia Edible Oil Market Revenues & Volume, By , 2022-2032F |
6.2 Slovenia Edible Oil Market, By Packaging Type |
6.2.1 Overview and Analysis |
6.2.2 Slovenia Edible Oil Market Revenues & Volume, By Pouches, 2022-2032F |
6.2.3 Slovenia Edible Oil Market Revenues & Volume, By Jars, 2022-2032F |
6.2.4 Slovenia Edible Oil Market Revenues & Volume, By Cans, 2022-2032F |
6.2.5 Slovenia Edible Oil Market Revenues & Volume, By Bottles, 2022-2032F |
6.2.6 Slovenia Edible Oil Market Revenues & Volume, By , 2022-2032F |
6.3 Slovenia Edible Oil Market, By Pack Size |
6.3.1 Overview and Analysis |
6.3.2 Slovenia Edible Oil Market Revenues & Volume, By Less than 1 Litres, 2022-2032F |
6.3.3 Slovenia Edible Oil Market Revenues & Volume, By 1 Litres, 2022-2032F |
6.3.4 Slovenia Edible Oil Market Revenues & Volume, By 1 Litres - 5 litres, 2022-2032F |
6.3.5 Slovenia Edible Oil Market Revenues & Volume, By 5 Litres - 10 Litres, 2022-2032F |
6.3.6 Slovenia Edible Oil Market Revenues & Volume, By 10 Litres and Above, 2022-2032F |
6.3.7 Slovenia Edible Oil Market Revenues & Volume, By , 2022-2032F |
6.4 Slovenia Edible Oil Market, By Packaging Material |
6.4.1 Overview and Analysis |
6.4.2 Slovenia Edible Oil Market Revenues & Volume, By Metal, 2022-2032F |
6.4.3 Slovenia Edible Oil Market Revenues & Volume, By Plastic, 2022-2032F |
6.4.4 Slovenia Edible Oil Market Revenues & Volume, By Paper, 2022-2032F |
6.4.5 Slovenia Edible Oil Market Revenues & Volume, By Others, 2022-2032F |
6.5 Slovenia Edible Oil Market, By Application |
6.5.1 Overview and Analysis |
6.5.2 Slovenia Edible Oil Market Revenues & Volume, By HoReCa, 2022-2032F |
6.5.3 Slovenia Edible Oil Market Revenues & Volume, By Home Users, 2022-2032F |
6.5.4 Slovenia Edible Oil Market Revenues & Volume, By Food Processing Industry, 2022-2032F |
6.5.5 Slovenia Edible Oil Market Revenues & Volume, By , 2022-2032F |
6.6 Slovenia Edible Oil Market, By Distribution Channel |
6.6.1 Overview and Analysis |
6.6.2 Slovenia Edible Oil Market Revenues & Volume, By Direct/Institutional Sales, 2022-2032F |
6.6.3 Slovenia Edible Oil Market Revenues & Volume, By Supermarkets and Hypermarkets, 2022-2032F |
6.6.4 Slovenia Edible Oil Market Revenues & Volume, By Convenience Stores, 2022-2032F |
6.6.5 Slovenia Edible Oil Market Revenues & Volume, By Online, 2022-2032F |
6.6.6 Slovenia Edible Oil Market Revenues & Volume, By Others, 2022-2032F |
7 Slovenia Edible Oil Market Import-Export Trade Statistics |
7.1 Slovenia Edible Oil Market Export to Major Countries |
7.2 Slovenia Edible Oil Market Imports from Major Countries |
8 Slovenia Edible Oil Market Key Performance Indicators |
8.1 Consumer preference for healthier cooking oils |
8.2 Market penetration of premium edible oil brands |
8.3 Adoption rate of organic and natural edible oils |
9 Slovenia Edible Oil Market - Opportunity Assessment |
9.1 Slovenia Edible Oil Market Opportunity Assessment, By Type, 2022 & 2032F |
9.2 Slovenia Edible Oil Market Opportunity Assessment, By Packaging Type, 2022 & 2032F |
9.3 Slovenia Edible Oil Market Opportunity Assessment, By Pack Size, 2022 & 2032F |
9.4 Slovenia Edible Oil Market Opportunity Assessment, By Packaging Material, 2022 & 2032F |
9.5 Slovenia Edible Oil Market Opportunity Assessment, By Application, 2022 & 2032F |
9.6 Slovenia Edible Oil Market Opportunity Assessment, By Distribution Channel, 2022 & 2032F |
10 Slovenia Edible Oil Market - Competitive Landscape |
10.1 Slovenia Edible Oil Market Revenue Share, By Companies, 2025 |
10.2 Slovenia Edible Oil Market Competitive Benchmarking, By Operating and Technical Parameters |
11 Company Profiles |
12 Recommendations | 13 Disclaimer |
Global Go To Market Strategy - 2030
Export potential enables firms to identify high-growth global markets with greater confidence by combining advanced trade intelligence with a structured quantitative methodology. The framework analyzes emerging demand trends and country-level import patterns while integrating macroeconomic and trade datasets such as GDP and population forecasts, bilateral import–export flows, tariff structures, elasticity differentials between developed and developing economies, geographic distance, and import demand projections. Using weighted trade values from 2020–2024 as the base period to project country-to-country export potential for 2030, these inputs are operationalized through calculated drivers such as gravity model parameters, tariff impact factors, and projected GDP per-capita growth. Through an analysis of hidden potentials, demand hotspots, and market conditions that are most favorable to success, this method enables firms to focus on target countries, maximize returns, and global expansion with data, backed by accuracy.
By factoring in the projected importer demand gap that is currently unmet and could be potential opportunity, it identifies the potential for the Exporter (Country) among 190 countries, against the general trade analysis, which identifies the biggest importer or exporter.
To discover high-growth global markets and optimize your business strategy:
Click Here
Pricing
- Single User License$ 1,995
- Department License$ 2,400
- Site License$ 3,120
- Global License$ 3,795

Leadership Perspectives from Industry Events
Search
Thought Leadership and Analyst Meet


Our Clients
6WResearch In News
- India Export Attractiveness Tracker 2026
- India Air Conditioner Market Set for Strong Rebound in 2026 After Weather-Led Correction and GST-Driven Recovery: 6Wresearch
- ADAS in India: How Automatic Emergency Braking, Blind Spot Detection & Driver Monitoring are Transforming Road Safety
- Doha a strategic location for EV manufacturing hub: IPA Qatar
- Demand for luxury TVs surging in the GCC, says Samsung
- Empowering Growth: The Thriving Journey of Bangladesh’s Cable Industry
Latest Reports
- Nicaragua RPG Gaming Market (2026-2032)
- New Zealand RPG Gaming Market (2026-2032)
- Netherlands RPG Gaming Market (2026-2032)
- Nauru RPG Gaming Market (2026-2032)
- Namibia RPG Gaming Market (2026-2032)
- Mozambique RPG Gaming Market (2026-2032)
- Montenegro RPG Gaming Market (2026-2032)
- Mongolia RPG Gaming Market (2026-2032)
- Monaco RPG Gaming Market (2026-2032)
- Micronesia RPG Gaming Market (2026-2032)
Industry Events and Analyst Meet

EV India Expo 2026

HIMTEX 2026

India Refining Summit 2026

India EV Show 2026

EV tech India Expo 2026
Whitepaper
- Middle East & Africa Commercial Security Market Click here to view more.
- Middle East & Africa Fire Safety Systems & Equipment Market Click here to view more.
- GCC Drone Market Click here to view more.
- Middle East Lighting Fixture Market Click here to view more.
- GCC Physical & Perimeter Security Market Click here to view more.