Switzerland Data Center Blade Server Market (2026-2032) | Value, Analysis, Forecast, Growth, Companies, Trends, Segmentation, Industry, Revenue, Size, Share & Outlook
Market Forecast By Data Center Type (Tier 1, Tier 2, Tier 3, Tier 4), By End User (Small, Medium, Large), By Services (Consulting services, Installation and support services, Professional services), By IT and Telecom (BFSI, Public sector, Healthcare, Energy, Manufacturing, Media and Entertainment, Others) And Competitive Landscape
| Product Code: ETC5512674 | Publication Date: Nov 2023 | Updated Date: Mar 2026 | Product Type: Market Research Report | |
| Publisher: 6Wresearch | Author: Vasudha | No. of Pages: 60 | No. of Figures: 30 | No. of Tables: 5 |
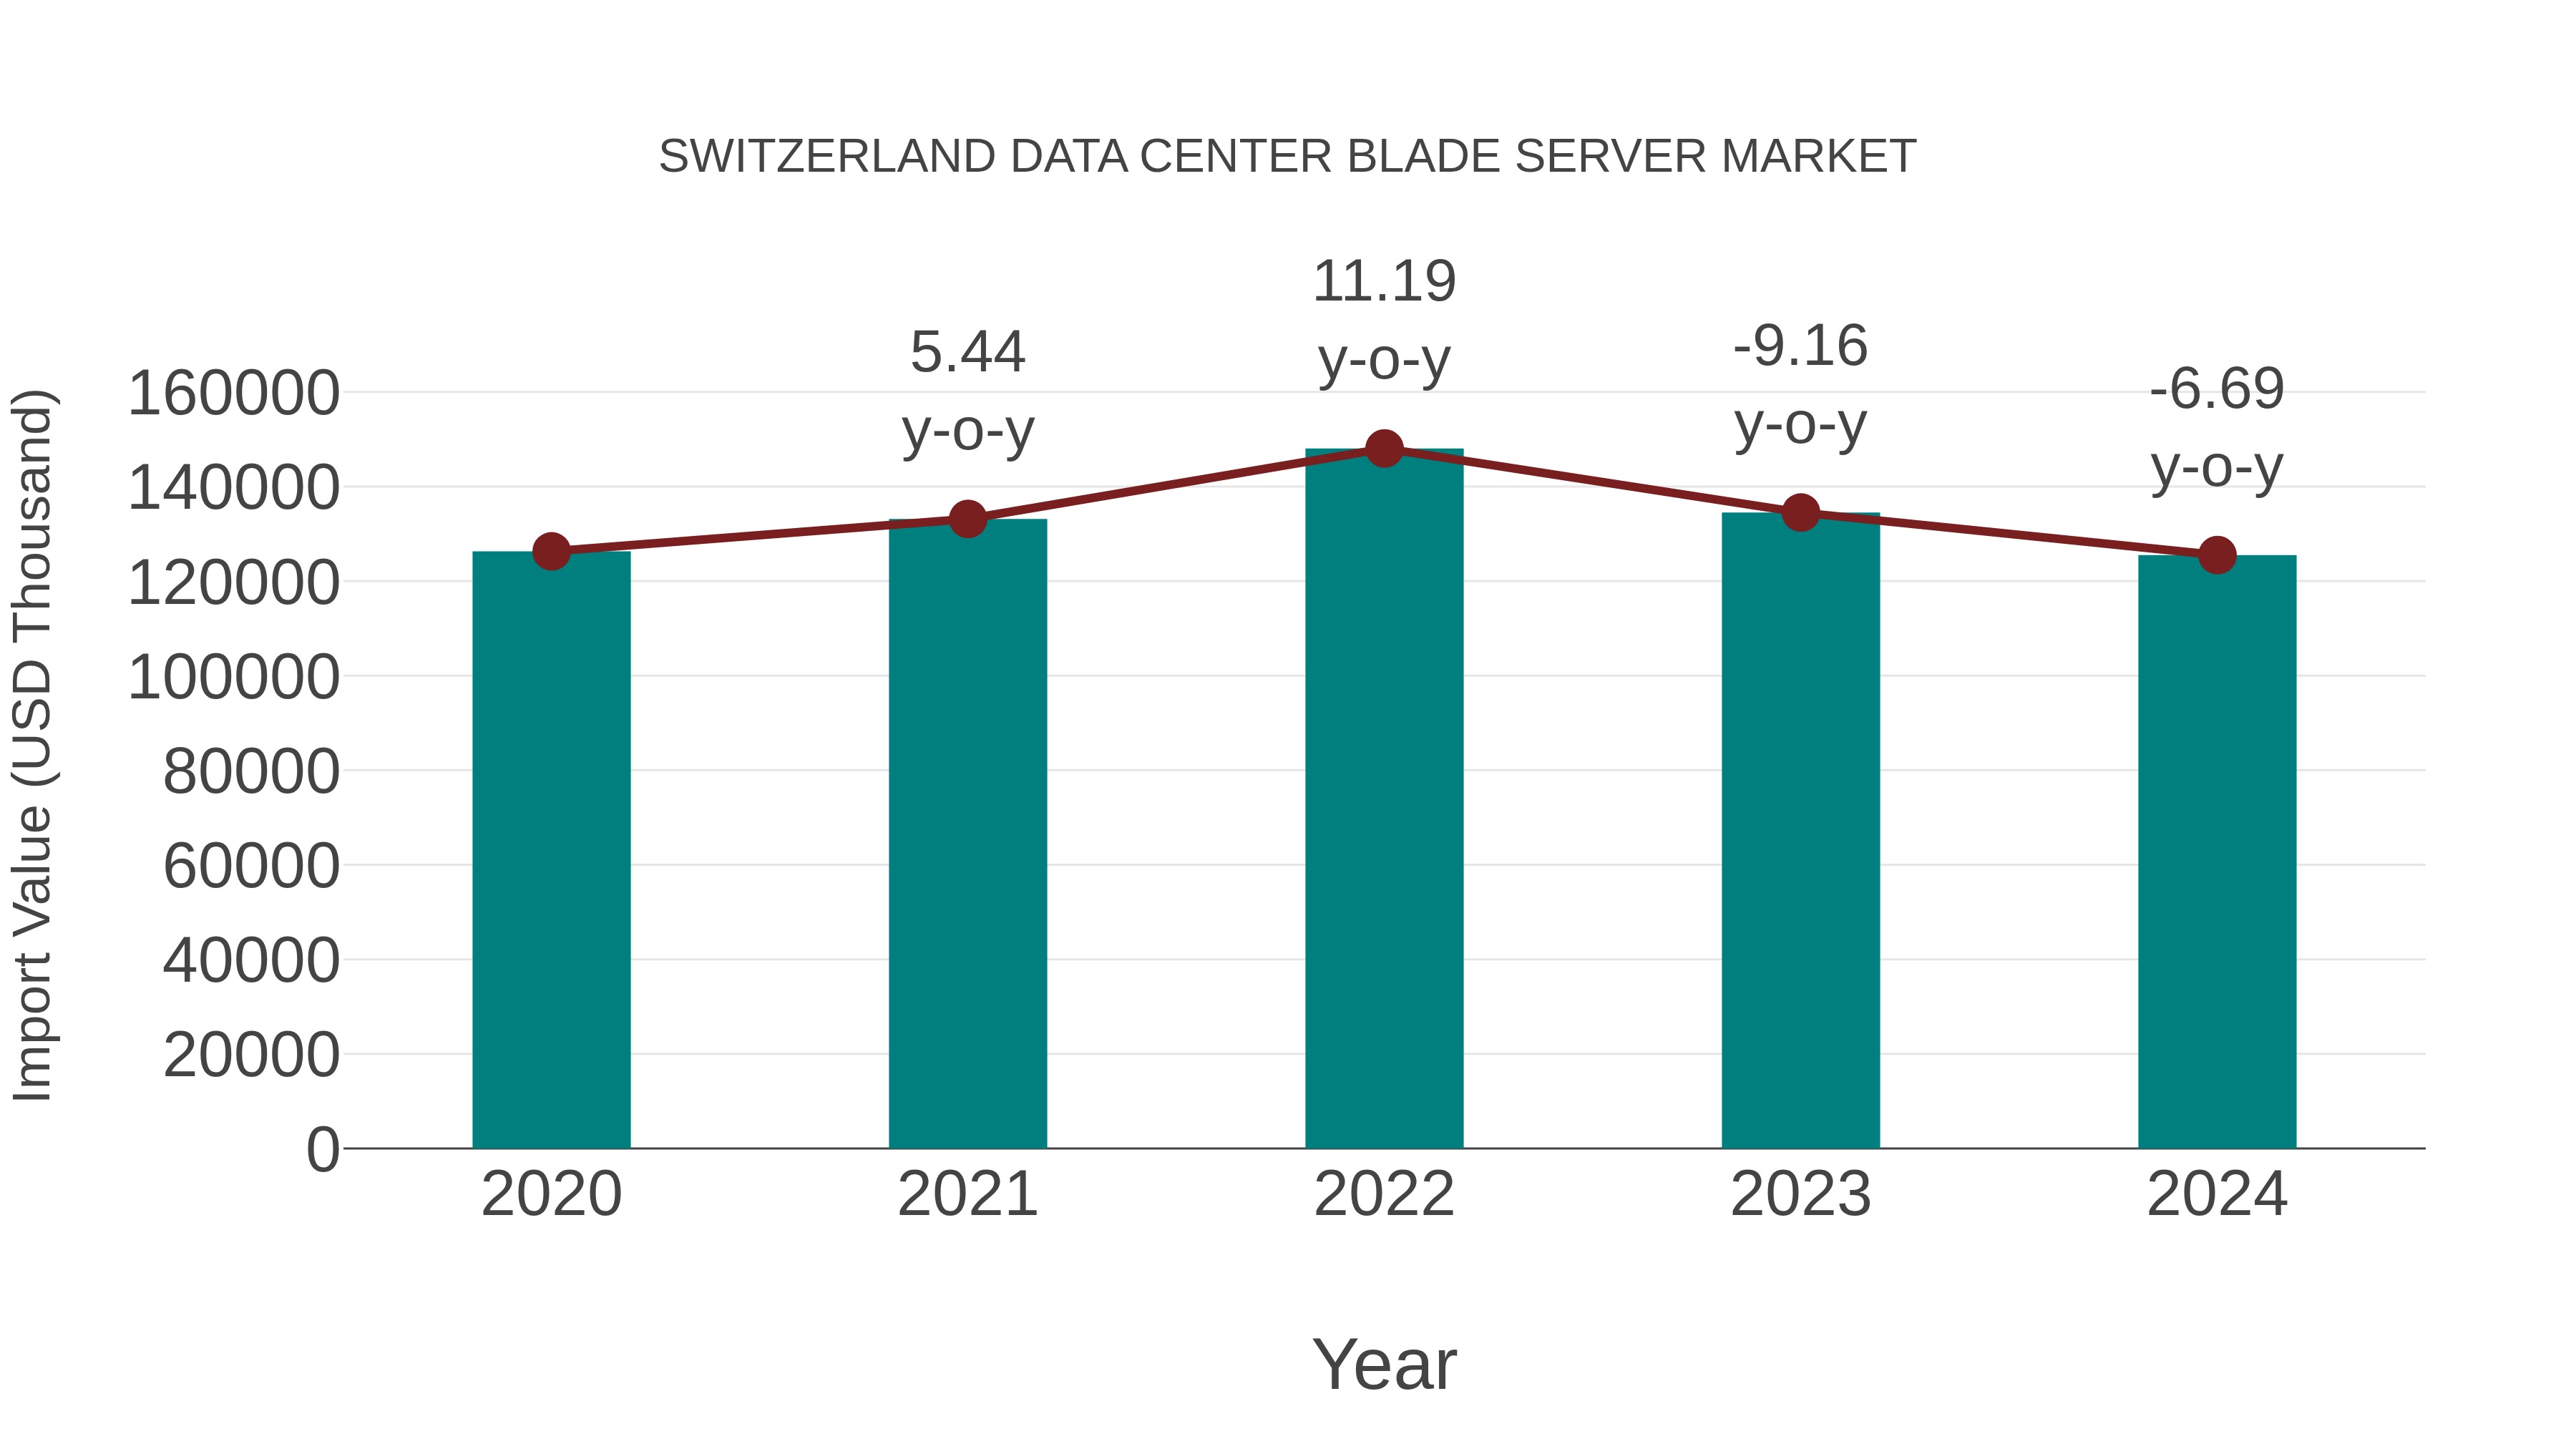
Switzerland Data Center Blade Server Market: Import Trend Analysis
Switzerland import trend for the data center blade server market showed a decline with a growth rate of -6.69% from 2023 to 2024. The compound annual growth rate (CAGR) for the period 2020-2024 was -0.16%. This downward trend could be attributed to shifts in technology preferences or evolving market dynamics.
Switzerland Data Center Blade Server Market Overview
The Data Center Blade Server Market in Switzerland is characterized by a growing preference for compact and efficient server solutions. Blade servers offer high density and scalability, making them ideal for modern data centers that require efficient space utilization. The market is driven by the increasing demand for cloud computing and virtualization, which necessitate flexible and powerful server architectures.
Drivers of the market
The Switzerland Data Center Blade Server Market is influenced by the demand for space-saving and energy-efficient computing solutions. As organizations seek to optimize their data center space and reduce power consumption, blade servers offer a compelling solution by providing high-density computing capabilities. The increasing adoption of virtualization and cloud services further drives the demand for blade servers, as they enable efficient resource allocation and management. Additionally, advancements in blade server technology, including improved performance and scalability, contribute to market growth.
Challenges of the market
In the blade server market, competition from other server architectures presents a challenge. Organizations must evaluate the cost-benefit ratio of blade servers versus alternative options, which can lead to slower adoption rates. Additionally, managing heat and power consumption remains a concern, particularly as data centers aim for sustainability.
Government Policy of the market
The blade server market in Switzerland is shaped by government policies that promote energy-efficient computing solutions. Regulations encourage the use of compact, high-performance servers that reduce power consumption. The government supports initiatives aimed at advancing server technology, enhancing performance while minimizing environmental impact.
Key Highlights of the Report:
- Switzerland Data Center Blade Server Market Outlook
- Market Size of Switzerland Data Center Blade Server Market, 2025
- Forecast of Switzerland Data Center Blade Server Market, 2032
- Historical Data and Forecast of Switzerland Data Center Blade Server Revenues & Volume for the Period 2022-2032F
- Switzerland Data Center Blade Server Market Trend Evolution
- Switzerland Data Center Blade Server Market Drivers and Challenges
- Switzerland Data Center Blade Server Price Trends
- Switzerland Data Center Blade Server Porter`s Five Forces
- Switzerland Data Center Blade Server Industry Life Cycle
- Historical Data and Forecast of Switzerland Data Center Blade Server Market Revenues & Volume By Data Center Type for the Period 2022-2032F
- Historical Data and Forecast of Switzerland Data Center Blade Server Market Revenues & Volume By Tier 1 for the Period 2022-2032F
- Historical Data and Forecast of Switzerland Data Center Blade Server Market Revenues & Volume By Tier 2 for the Period 2022-2032F
- Historical Data and Forecast of Switzerland Data Center Blade Server Market Revenues & Volume By Tier 3 for the Period 2022-2032F
- Historical Data and Forecast of Switzerland Data Center Blade Server Market Revenues & Volume By Tier 4 for the Period 2022-2032F
- Historical Data and Forecast of Switzerland Data Center Blade Server Market Revenues & Volume By End User for the Period 2022-2032F
- Historical Data and Forecast of Switzerland Data Center Blade Server Market Revenues & Volume By Small for the Period 2022-2032F
- Historical Data and Forecast of Switzerland Data Center Blade Server Market Revenues & Volume By Medium for the Period 2022-2032F
- Historical Data and Forecast of Switzerland Data Center Blade Server Market Revenues & Volume By Large for the Period 2022-2032F
- Historical Data and Forecast of Switzerland Data Center Blade Server Market Revenues & Volume By Services for the Period 2022-2032F
- Historical Data and Forecast of Switzerland Data Center Blade Server Market Revenues & Volume By Consulting services for the Period 2022-2032F
- Historical Data and Forecast of Switzerland Data Center Blade Server Market Revenues & Volume By Installation and support services for the Period 2022-2032F
- Historical Data and Forecast of Switzerland Data Center Blade Server Market Revenues & Volume By Professional services for the Period 2022-2032F
- Historical Data and Forecast of Switzerland Data Center Blade Server Market Revenues & Volume By IT and Telecom for the Period 2022-2032F
- Historical Data and Forecast of Switzerland Data Center Blade Server Market Revenues & Volume By BFSI for the Period 2022-2032F
- Historical Data and Forecast of Switzerland Data Center Blade Server Market Revenues & Volume By Public sector for the Period 2022-2032F
- Historical Data and Forecast of Switzerland Data Center Blade Server Market Revenues & Volume By Healthcare for the Period 2022-2032F
- Historical Data and Forecast of Switzerland Data Center Blade Server Market Revenues & Volume By Energy for the Period 2022-2032F
- Historical Data and Forecast of Switzerland Data Center Blade Server Market Revenues & Volume By Manufacturing for the Period 2022-2032F
- Historical Data and Forecast of Switzerland Data Center Blade Server Market Revenues & Volume By Media and Entertainment for the Period 2022-2032F
- Historical Data and Forecast of Switzerland Data Center Blade Server Market Revenues & Volume By Others for the Period 2022-2032F
- Switzerland Data Center Blade Server Import Export Trade Statistics
- Market Opportunity Assessment By Data Center Type
- Market Opportunity Assessment By End User
- Market Opportunity Assessment By Services
- Market Opportunity Assessment By IT and Telecom
- Switzerland Data Center Blade Server Top Companies Market Share
- Switzerland Data Center Blade Server Competitive Benchmarking By Technical and Operational Parameters
- Switzerland Data Center Blade Server Company Profiles
- Switzerland Data Center Blade Server Key Strategic Recommendations
Switzerland Data Center Blade Server Market (2026-2032): FAQs
6Wresearch actively monitors the Switzerland Data Center Blade Server Market and publishes its comprehensive annual report, highlighting emerging trends, growth drivers, revenue analysis, and forecast outlook. Our insights help businesses to make data-backed strategic decisions with ongoing market dynamics. Our analysts track relevent industries related to the Switzerland Data Center Blade Server Market, allowing our clients with actionable intelligence and reliable forecasts tailored to emerging regional needs.
Yes, we provide customisation as per your requirements. To learn more, feel free to contact us on sales@6wresearch.com
1 Executive Summary |
2 Introduction |
2.1 Key Highlights of the Report |
2.2 Report Description |
2.3 Market Scope & Segmentation |
2.4 Research Methodology |
2.5 Assumptions |
3 Switzerland Data Center Blade Server Market Overview |
3.1 Switzerland Country Macro Economic Indicators |
3.2 Switzerland Data Center Blade Server Market Revenues & Volume, 2022 & 2032F |
3.3 Switzerland Data Center Blade Server Market - Industry Life Cycle |
3.4 Switzerland Data Center Blade Server Market - Porter's Five Forces |
3.5 Switzerland Data Center Blade Server Market Revenues & Volume Share, By Data Center Type , 2022 & 2032F |
3.6 Switzerland Data Center Blade Server Market Revenues & Volume Share, By End User , 2022 & 2032F |
3.7 Switzerland Data Center Blade Server Market Revenues & Volume Share, By Services , 2022 & 2032F |
3.8 Switzerland Data Center Blade Server Market Revenues & Volume Share, By IT and Telecom, 2022 & 2032F |
4 Switzerland Data Center Blade Server Market Dynamics |
4.1 Impact Analysis |
4.2 Market Drivers |
4.2.1 Increasing demand for high-performance computing and data processing capabilities in Switzerland. |
4.2.2 Growing adoption of cloud services and data analytics driving the need for efficient data center solutions. |
4.2.3 Emphasis on energy efficiency and sustainability in data center operations, leading to the preference for blade servers. |
4.3 Market Restraints |
4.3.1 High initial investment costs associated with setting up and maintaining blade server infrastructure. |
4.3.2 Limited availability of skilled IT professionals for managing complex blade server systems in Switzerland. |
5 Switzerland Data Center Blade Server Market Trends |
6 Switzerland Data Center Blade Server Market Segmentations |
6.1 Switzerland Data Center Blade Server Market, By Data Center Type |
6.1.1 Overview and Analysis |
6.1.2 Switzerland Data Center Blade Server Market Revenues & Volume, By Tier 1, 2022-2032F |
6.1.3 Switzerland Data Center Blade Server Market Revenues & Volume, By Tier 2, 2022-2032F |
6.1.4 Switzerland Data Center Blade Server Market Revenues & Volume, By Tier 3, 2022-2032F |
6.1.5 Switzerland Data Center Blade Server Market Revenues & Volume, By Tier 4, 2022-2032F |
6.2 Switzerland Data Center Blade Server Market, By End User |
6.2.1 Overview and Analysis |
6.2.2 Switzerland Data Center Blade Server Market Revenues & Volume, By Small, 2022-2032F |
6.2.3 Switzerland Data Center Blade Server Market Revenues & Volume, By Medium, 2022-2032F |
6.2.4 Switzerland Data Center Blade Server Market Revenues & Volume, By Large, 2022-2032F |
6.3 Switzerland Data Center Blade Server Market, By Services |
6.3.1 Overview and Analysis |
6.3.2 Switzerland Data Center Blade Server Market Revenues & Volume, By Consulting services, 2022-2032F |
6.3.3 Switzerland Data Center Blade Server Market Revenues & Volume, By Installation and support services, 2022-2032F |
6.3.4 Switzerland Data Center Blade Server Market Revenues & Volume, By Professional services, 2022-2032F |
6.4 Switzerland Data Center Blade Server Market, By IT and Telecom |
6.4.1 Overview and Analysis |
6.4.2 Switzerland Data Center Blade Server Market Revenues & Volume, By BFSI, 2022-2032F |
6.4.3 Switzerland Data Center Blade Server Market Revenues & Volume, By Public sector, 2022-2032F |
6.4.4 Switzerland Data Center Blade Server Market Revenues & Volume, By Healthcare, 2022-2032F |
6.4.5 Switzerland Data Center Blade Server Market Revenues & Volume, By Energy, 2022-2032F |
6.4.6 Switzerland Data Center Blade Server Market Revenues & Volume, By Manufacturing, 2022-2032F |
6.4.7 Switzerland Data Center Blade Server Market Revenues & Volume, By Media and Entertainment, 2022-2032F |
7 Switzerland Data Center Blade Server Market Import-Export Trade Statistics |
7.1 Switzerland Data Center Blade Server Market Export to Major Countries |
7.2 Switzerland Data Center Blade Server Market Imports from Major Countries |
8 Switzerland Data Center Blade Server Market Key Performance Indicators |
8.1 Power Usage Effectiveness (PUE) to measure energy efficiency in data center operations. |
8.2 Average server utilization rates to monitor the efficiency of blade server deployment. |
8.3 Mean Time Between Failures (MTBF) to assess the reliability and performance of blade servers. |
9 Switzerland Data Center Blade Server Market - Opportunity Assessment |
9.1 Switzerland Data Center Blade Server Market Opportunity Assessment, By Data Center Type , 2022 & 2032F |
9.2 Switzerland Data Center Blade Server Market Opportunity Assessment, By End User , 2022 & 2032F |
9.3 Switzerland Data Center Blade Server Market Opportunity Assessment, By Services , 2022 & 2032F |
9.4 Switzerland Data Center Blade Server Market Opportunity Assessment, By IT and Telecom, 2022 & 2032F |
10 Switzerland Data Center Blade Server Market - Competitive Landscape |
10.1 Switzerland Data Center Blade Server Market Revenue Share, By Companies, 2025 |
10.2 Switzerland Data Center Blade Server Market Competitive Benchmarking, By Operating and Technical Parameters |
11 Company Profiles |
12 Recommendations | 13 Disclaimer |
Global Go To Market Strategy - 2030
Export potential enables firms to identify high-growth global markets with greater confidence by combining advanced trade intelligence with a structured quantitative methodology. The framework analyzes emerging demand trends and country-level import patterns while integrating macroeconomic and trade datasets such as GDP and population forecasts, bilateral import–export flows, tariff structures, elasticity differentials between developed and developing economies, geographic distance, and import demand projections. Using weighted trade values from 2020–2024 as the base period to project country-to-country export potential for 2030, these inputs are operationalized through calculated drivers such as gravity model parameters, tariff impact factors, and projected GDP per-capita growth. Through an analysis of hidden potentials, demand hotspots, and market conditions that are most favorable to success, this method enables firms to focus on target countries, maximize returns, and global expansion with data, backed by accuracy.
By factoring in the projected importer demand gap that is currently unmet and could be potential opportunity, it identifies the potential for the Exporter (Country) among 190 countries, against the general trade analysis, which identifies the biggest importer or exporter.
To discover high-growth global markets and optimize your business strategy:
Click Here
Pricing
- Single User License$ 1,995
- Department License$ 2,400
- Site License$ 3,120
- Global License$ 3,795

Leadership Perspectives from Industry Events
Search
Thought Leadership and Analyst Meet


Our Clients
6WResearch In News
- Doha a strategic location for EV manufacturing hub: IPA Qatar
- Demand for luxury TVs surging in the GCC, says Samsung
- Empowering Growth: The Thriving Journey of Bangladesh’s Cable Industry
- Demand for luxury TVs surging in the GCC, says Samsung
- Video call with a traditional healer? Once unthinkable, it’s now common in South Africa
- Intelligent Buildings To Smooth GCC’s Path To Net Zero
Latest Reports
- Poland Fire Protection Systems Market (2026-2032)
- Cape Verde Portable Hand-Thrown Extinguisher Market (2026-2032)
- Canada Portable Hand-Thrown Extinguisher Market (2026-2032)
- Cameroon Portable Hand-Thrown Extinguisher Market (2026-2032)
- Burundi Portable Hand-Thrown Extinguisher Market (2026-2032)
- Burkina Faso Portable Hand-Thrown Extinguisher Market (2026-2032)
- Bulgaria Portable Hand-Thrown Extinguisher Market (2026-2032)
- Brunei Portable Hand-Thrown Extinguisher Market (2026-2032)
- Botswana Portable Hand-Thrown Extinguisher Market (2026-2032)
- Bosnia and Herzegovina Portable Hand-Thrown Extinguisher Market (2026-2032)
Industry Events and Analyst Meet

HIMTEX 2026

India Refining Summit 2026

India EV Show 2026

EV tech India Expo 2026

Auto Tech Asia 2026
Whitepaper
- Middle East & Africa Commercial Security Market Click here to view more.
- Middle East & Africa Fire Safety Systems & Equipment Market Click here to view more.
- GCC Drone Market Click here to view more.
- Middle East Lighting Fixture Market Click here to view more.
- GCC Physical & Perimeter Security Market Click here to view more.