Tanzania Borax Market (2026-2032) Outlook | Trends, Growth, Forecast, Value, Share, Size, Revenue, Companies, Industry & Analysis
Market Forecast By Types (Anhydrous Borax, Borax Pentahydrate, Borax Decahydrate), By Applications (Agriculture, Transportation, Building and Construction, Detergents, Healthcare, Electronics, Others) And Competitive Landscape
| Product Code: ETC192847 | Publication Date: May 2022 | Updated Date: Jun 2026 | Product Type: Market Research Report | |
| Publisher: 6Wresearch | Author: Vasudha | No. of Pages: 60 | No. of Figures: 40 | No. of Tables: 7 |
Tanzania Borax Market Size, Share & Growth Rate
The Tanzania Borax Market was estimated at USD 392 Million in 2025 and is projected to reach USD 558 Million by 2032, growing at a CAGR of 5.2% from 2026 to 2032. This growth is primarily driven by rising applications of borax across agriculture, mining, and manufacturing sectors. The growing awareness of borax as an eco-friendly alternative further fuels demand, while Tanzania's rich natural reserves and supportive mining policies create a favorable landscape for industry expansion.
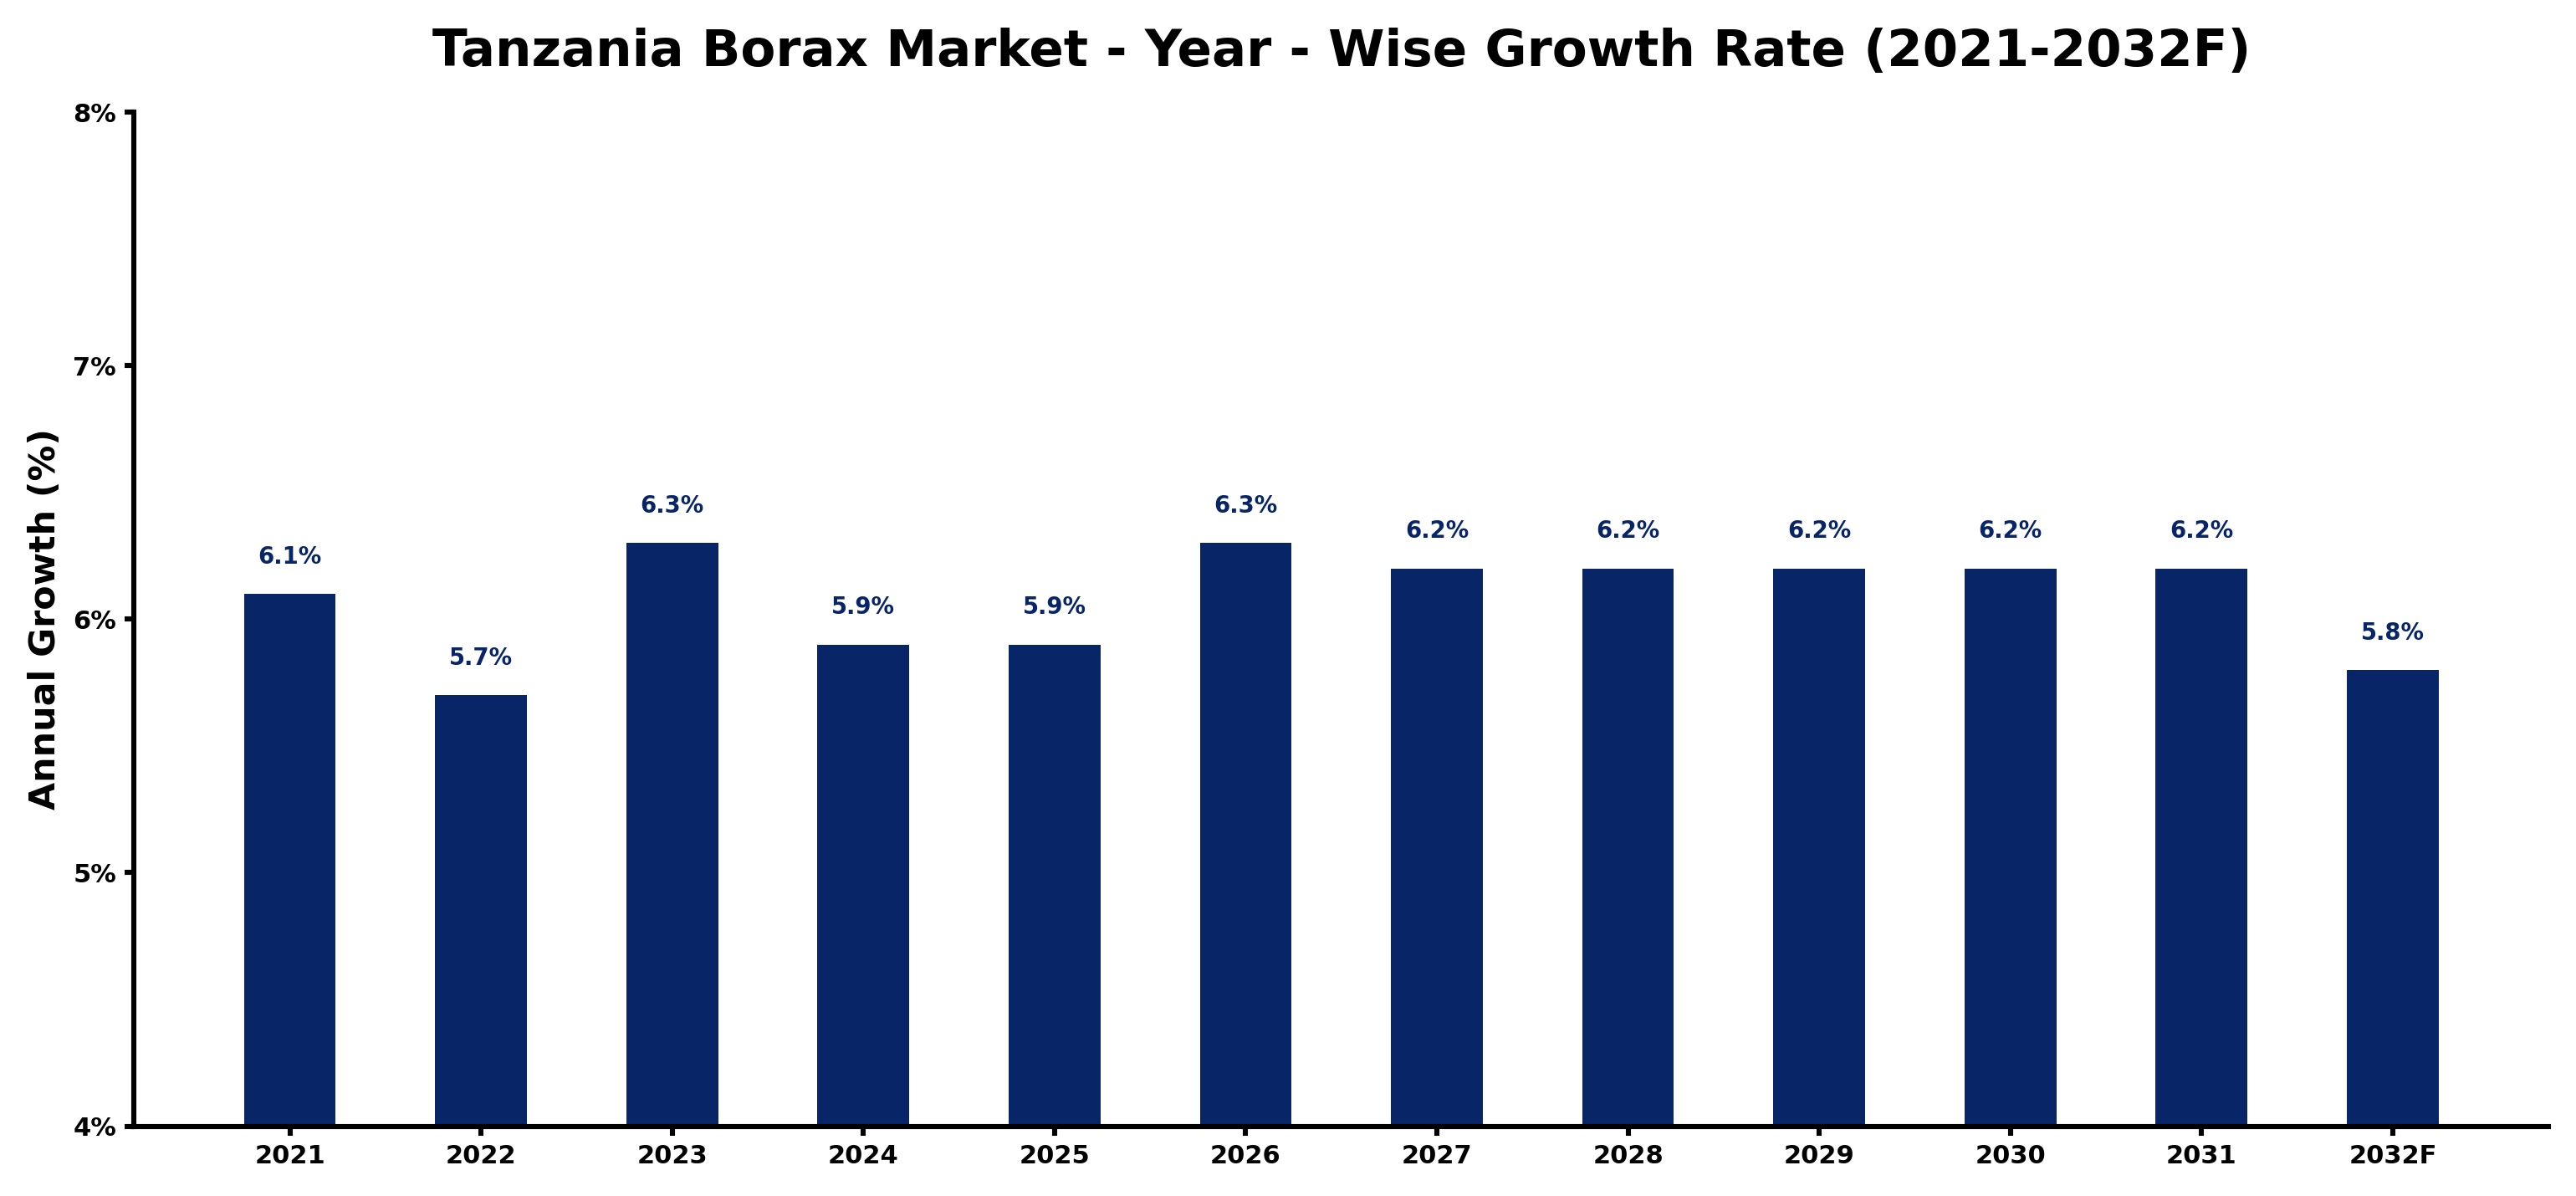
Tanzania Borax Market Growth Rate Analysis (2021-2032)
The Tanzania borax market has shown a stable growth trend, with notable yearly fluctuations over the past few years. In 2021, growth was recorded at 6.1%, reflecting strong demand driven by the expansion of the agricultural and manufacturing sectors. This momentum slightly decreased to 5.7% in 2022, likely impacted by supply chain disruptions and inflationary pressures. However, the market rebounded to 6.3% in 2023, fueled by increased investments in mining and infrastructure development. Forecasts suggest a continued robust performance, with projected growth rates around 6.2% through 2030. Factors such as energy transition initiatives and rising consumer demand for sustainable materials will further bolster this market, despite a slight dip to 5.8% anticipated in 2032.
Tanzania Borax Market Year-wise Growth Rate and Key Drivers
This graph highlights how the Tanzania Borax Market has steadily grown over the past five years, supported by major growth factors.
The table below presents the year‑wise growth rates along with the key drivers influencing the market
| Year | Growth Rate | Major Drivers |
| 2021 | 6.1% | Increased industrial applications emerged |
| 2022 | 5.7% | Growing demand for cleaning products |
| 2023 | 6.3% | Agricultural sector expansion accelerated |
| 2024 | 5.9% | Rising consumer awareness of benefits |
| 2025 | 5.9% | Construction industry growth stimulated demand |
| 2026 | 6.3% | Technological advancements enhanced production |
| 2027 | 6.2% | Export opportunities expanded significantly |
| 2028 | 6.2% | Sustainability trends drove market interest |
| 2029 | 6.2% | Partnerships with local manufacturers increased |
| 2030 | 6.2% | Regulatory support bolstered market growth |
| 2031 | 6.2% | Investment in research and development |
| 2032 | 5.8% | Consumer preferences shifted positively |
Note - Market size estimations and growth projections presented in this report are based on 6Wresearch’s advanced forecasting approach, validated with industry datasets as of June 2026.
Tanzania Borax Market Synopsis
Tanzania's abundant borax reserves are a key factor in the market’s potential. The mineral is increasingly utilized in the production of fertilizers, thereby enhancing agricultural yields, which is critical for a country with a substantial agrarian economy.
Additionally, the household sector is witnessing increased borax consumption due to its effectiveness as a cleaning agent and pest control solution. This trend further broadens the application spectrum and solidifies borax's position as an essential commodity in Tanzanian households.
Tanzania Borax Market Key Takeaways
- Tanzania is positioning itself as a significant player in the global borax market due to its rich mineral resources.
- The market is experiencing robust demand from agriculture, particularly in fertilizer production.
- Eco-friendly initiatives are enhancing the appeal of borax across various sectors.
- Infrastructure challenges remain a concern, impacting transportation and mining efficiency.
- Government regulations are geared towards promoting sustainable practices and safeguarding the environment.
Evaluation of Restraints in Tanzania Borax Market
Despite the promising prospects, the Tanzania Borax Market faces several constraints that could hinder growth. Limited infrastructure for mining and transportation poses a significant challenge, as it affects the efficiency and cost-effectiveness of borax extraction and distribution. Moreover, fluctuating global demand can lead to price volatility, making it difficult for local producers to maintain stable profit margins. Environmental concerns related to mining practices also cast a shadow on the market, necessitating a careful balance between economic growth and sustainability.
Tanzania Borax Market Trends
Several trends are shaping the Tanzania Borax Market, including an increasing integration of sustainable practices in mining operations. Companies are gradually adopting greener technologies that minimize environmental impact. Furthermore, there is a growing trend towards innovation in borax applications, especially within the cosmetics and specialty chemicals sectors. The dual focus on sustainability and technological advancements is likely to redefine product offerings and enhance market competitiveness.
Tanzania Borax Market Opportunities
The Tanzania Borax Market presents numerous investment opportunities, particularly in the mining and processing sectors. Investors can capitalize on the rising global demand for boron-based products by engaging in extraction and refining operations. Additionally, research and development initiatives aimed at identifying new applications for borax hold significant potential for long-term growth. The government's supportive policies and strategic location further enhance the investment landscape, making Tanzania an attractive destination for stakeholders in the borax industry.
Government Initiatives in the Tanzania Borax Market
The Tanzanian government has established a regulatory framework to foster the sustainable development of the borax market. The Mining Act of 2010 is a cornerstone policy, mandating compliance with environmental standards and licensing requirements for companies in the sector. In addition, the government is actively promoting responsible mining practices that not only maximize economic returns but also prioritize ecological conservation. These initiatives are essential for creating a balanced approach to resource management in the borax industry.
Future Insights of the Tanzania Borax Market
Looking ahead to 2026-2032, the Tanzania Borax Market is expected to sustain its growth trajectory. The demand for borax across various industries, particularly agriculture, pharmaceuticals, and cleaning products, is likely to escalate. Innovations in product development and a continued emphasis on sustainability will further propel the market forward. However, stakeholders must remain vigilant regarding potential price fluctuations and competition from alternative materials. Overall, the future of the Tanzania Borax Market appears optimistic, backed by strong fundamentals and evolving market dynamics.
Tanzania Borax Market Latest Developments (May 2025 - June 2026)
Recent developments within the Tanzania Borax Market have shown a concerted effort by both the government and industry players to enhance mining practices and promote sustainable usage. Ongoing dialogues around improving infrastructure and technology adoption suggest a proactive approach towards mitigating existing challenges. Additionally, initiatives aimed at fostering innovation in borax applications have been gaining traction, signaling a transformative phase for the market.
Tanzania Borax Market - Key Attractiveness of the Report
- 10 Years of Market Numbers
- Historical Data Starting from 2022 to 2025
- Base Year: 2025
- Forecast Data until 2032
- Key Performance Indicators Impacting the Market
- Major Upcoming Developments and Projects
Key Highlights of the Report:
- Tanzania Borax Market Outlook
- Market Size of Tanzania Borax Market, 2025
- Forecast of Tanzania Borax Market, 2032
- Historical Data and Forecast of Tanzania Borax Revenues & Volume for the Period 2022-2032F
- Tanzania Borax Market Trend Evolution
- Tanzania Borax Market Drivers and Challenges
- Tanzania Borax Price Trends
- Tanzania Borax Porter's Five Forces
- Tanzania Borax Industry Life Cycle
- Historical Data and Forecast of Tanzania Borax Market Revenues & Volume By Types for the Period 2022-2032F
- Historical Data and Forecast of Tanzania Borax Market Revenues & Volume By Anhydrous Borax for the Period 2022-2032F
- Historical Data and Forecast of Tanzania Borax Market Revenues & Volume By Borax Pentahydrate for the Period 2022-2032F
- Historical Data and Forecast of Tanzania Borax Market Revenues & Volume By Borax Decahydrate for the Period 2022-2032F
- Historical Data and Forecast of Tanzania Borax Market Revenues & Volume By Applications for the Period 2022-2032F
- Historical Data and Forecast of Tanzania Borax Market Revenues & Volume By Agriculture for the Period 2022-2032F
- Historical Data and Forecast of Tanzania Borax Market Revenues & Volume By Transportation for the Period 2022-2032F
- Historical Data and Forecast of Tanzania Borax Market Revenues & Volume By Building and Construction for the Period 2022-2032F
- Historical Data and Forecast of Tanzania Borax Market Revenues & Volume By Detergents for the Period 2022-2032F
- Historical Data and Forecast of Tanzania Borax Market Revenues & Volume By Healthcare for the Period 2022-2032F
- Historical Data and Forecast of Tanzania Borax Market Revenues & Volume By Electronics for the Period 2022-2032F
- Historical Data and Forecast of Tanzania Borax Market Revenues & Volume By Others for the Period 2022-2032F
- Tanzania Borax Import Export Trade Statistics
- Market Opportunity Assessment By Types
- Market Opportunity Assessment By Applications
- Tanzania Borax Top Companies Market Share
- Tanzania Borax Competitive Benchmarking By Technical and Operational Parameters
- Tanzania Borax Company Profiles
- Tanzania Borax Key Strategic Recommendations
Tanzania Borax Market - Frequently Asked Questions
The market is projected to grow from USD 392 Million in 2025 to USD 558 Million by 2032, reflecting a CAGR of 5.2% from 2026 to 2032, indicating strong demand and investment potential.
Key sectors driving demand include agriculture for fertilizers, manufacturing for ceramics and glass production, and the household segment for cleaning agents and pest control.
Yes, there is a growing trend towards adopting sustainable mining practices aimed at reducing environmental impact, ensuring that borax extraction is both economically viable and eco-friendly.
Producers encounter issues such as limited infrastructure, price volatility influenced by global demand, and environmental concerns regarding mining practices.
The government regulates the borax market through policies that promote sustainable mining practices and ensure compliance with environmental standards, fostering a responsible approach to resource management.
6Wresearch actively monitors the Tanzania Borax Market and publishes its comprehensive annual report, highlighting emerging trends, growth drivers, revenue analysis, and forecast outlook. Our insights help businesses to make data-backed strategic decisions with ongoing market dynamics. Our analysts track relevent industries related to the Tanzania Borax Market, allowing our clients with actionable intelligence and reliable forecasts tailored to emerging regional needs.
Yes, we provide customisation as per your requirements. To learn more, feel free to contact us on sales@6wresearch.com
1 Executive Summary |
2 Introduction |
2.1 Key Highlights of the Report |
2.2 Report Description |
2.3 Market Scope & Segmentation |
2.4 Research Methodology |
2.5 Assumptions |
3 Tanzania Borax Market Overview |
3.1 Tanzania Country Macro Economic Indicators |
3.2 Tanzania Borax Market Revenues & Volume, 2022 & 2032F |
3.3 Tanzania Borax Market - Industry Life Cycle |
3.4 Tanzania Borax Market - Porter's Five Forces |
3.5 Tanzania Borax Market Revenues & Volume Share, By Types, 2022 & 2032F |
3.6 Tanzania Borax Market Revenues & Volume Share, By Applications, 2022 & 2032F |
4 Tanzania Borax Market Dynamics |
4.1 Impact Analysis |
4.2 Market Drivers |
4.2.1 Increasing demand from industries such as ceramics, agriculture, and detergents |
4.2.2 Growing awareness about the benefits of borax in various applications |
4.2.3 Government initiatives promoting the use of borax in different sectors |
4.3 Market Restraints |
4.3.1 Fluctuating prices of raw materials impacting production costs |
4.3.2 Competition from substitutes like boric acid and other boron compounds |
4.3.3 Regulatory challenges related to environmental concerns and safety regulations |
5 Tanzania Borax Market Trends |
6 Tanzania Borax Market, By Types |
6.1 Tanzania Borax Market, By Types |
6.1.1 Overview and Analysis |
6.1.2 Tanzania Borax Market Revenues & Volume, By Types, 2022-2032F |
6.1.3 Tanzania Borax Market Revenues & Volume, By Anhydrous Borax, 2022-2032F |
6.1.4 Tanzania Borax Market Revenues & Volume, By Borax Pentahydrate, 2022-2032F |
6.1.5 Tanzania Borax Market Revenues & Volume, By Borax Decahydrate, 2022-2032F |
6.2 Tanzania Borax Market, By Applications |
6.2.1 Overview and Analysis |
6.2.2 Tanzania Borax Market Revenues & Volume, By Agriculture, 2022-2032F |
6.2.3 Tanzania Borax Market Revenues & Volume, By Transportation, 2022-2032F |
6.2.4 Tanzania Borax Market Revenues & Volume, By Building and Construction, 2022-2032F |
6.2.5 Tanzania Borax Market Revenues & Volume, By Detergents, 2022-2032F |
6.2.6 Tanzania Borax Market Revenues & Volume, By Healthcare, 2022-2032F |
6.2.7 Tanzania Borax Market Revenues & Volume, By Electronics, 2022-2032F |
7 Tanzania Borax Market Import-Export Trade Statistics |
7.1 Tanzania Borax Market Export to Major Countries |
7.2 Tanzania Borax Market Imports from Major Countries |
8 Tanzania Borax Market Key Performance Indicators |
8.1 Number of new applications or industries adopting borax |
8.2 Research and development investments in innovative borax products |
8.3 Percentage of market growth attributed to new borax applications |
8.4 Environmental and safety compliance metrics in borax production |
8.5 Adoption rate of sustainable practices in borax mining and processing |
9 Tanzania Borax Market - Opportunity Assessment |
9.1 Tanzania Borax Market Opportunity Assessment, By Types, 2022 & 2032F |
9.2 Tanzania Borax Market Opportunity Assessment, By Applications, 2022 & 2032F |
10 Tanzania Borax Market - Competitive Landscape |
10.1 Tanzania Borax Market Revenue Share, By Companies, 2025 |
10.2 Tanzania Borax Market Competitive Benchmarking, By Operating and Technical Parameters |
11 Company Profiles |
12 Recommendations |
13 Disclaimer |
Global Go To Market Strategy - 2030
Export potential enables firms to identify high-growth global markets with greater confidence by combining advanced trade intelligence with a structured quantitative methodology. The framework analyzes emerging demand trends and country-level import patterns while integrating macroeconomic and trade datasets such as GDP and population forecasts, bilateral import–export flows, tariff structures, elasticity differentials between developed and developing economies, geographic distance, and import demand projections. Using weighted trade values from 2020–2024 as the base period to project country-to-country export potential for 2030, these inputs are operationalized through calculated drivers such as gravity model parameters, tariff impact factors, and projected GDP per-capita growth. Through an analysis of hidden potentials, demand hotspots, and market conditions that are most favorable to success, this method enables firms to focus on target countries, maximize returns, and global expansion with data, backed by accuracy.
By factoring in the projected importer demand gap that is currently unmet and could be potential opportunity, it identifies the potential for the Exporter (Country) among 190 countries, against the general trade analysis, which identifies the biggest importer or exporter.
To discover high-growth global markets and optimize your business strategy:
Click Here
Pricing
- Single User License$ 1,995
- Department License$ 2,400
- Site License$ 3,120
- Global License$ 3,795

Leadership Perspectives from Industry Events
Search
Thought Leadership and Analyst Meet


Our Clients
6WResearch In News
- India Air Conditioner Market Set for Strong Rebound in 2026 After Weather-Led Correction and GST-Driven Recovery: 6Wresearch
- ADAS in India: How Automatic Emergency Braking, Blind Spot Detection & Driver Monitoring are Transforming Road Safety
- Doha a strategic location for EV manufacturing hub: IPA Qatar
- Demand for luxury TVs surging in the GCC, says Samsung
- Empowering Growth: The Thriving Journey of Bangladesh’s Cable Industry
- Demand for luxury TVs surging in the GCC, says Samsung
Latest Reports
- Poland Fire Protection Systems Market (2026-2032)
- Cape Verde Portable Hand-Thrown Extinguisher Market (2026-2032)
- Canada Portable Hand-Thrown Extinguisher Market (2026-2032)
- Cameroon Portable Hand-Thrown Extinguisher Market (2026-2032)
- Burundi Portable Hand-Thrown Extinguisher Market (2026-2032)
- Burkina Faso Portable Hand-Thrown Extinguisher Market (2026-2032)
- Bulgaria Portable Hand-Thrown Extinguisher Market (2026-2032)
- Brunei Portable Hand-Thrown Extinguisher Market (2026-2032)
- Botswana Portable Hand-Thrown Extinguisher Market (2026-2032)
- Bosnia and Herzegovina Portable Hand-Thrown Extinguisher Market (2026-2032)
Industry Events and Analyst Meet

HIMTEX 2026

India Refining Summit 2026

India EV Show 2026

EV tech India Expo 2026

Auto Tech Asia 2026
Whitepaper
- Middle East & Africa Commercial Security Market Click here to view more.
- Middle East & Africa Fire Safety Systems & Equipment Market Click here to view more.
- GCC Drone Market Click here to view more.
- Middle East Lighting Fixture Market Click here to view more.
- GCC Physical & Perimeter Security Market Click here to view more.