Tanzania Fish Processing Market (2026-2032) | Growth, Revenue, Size, Share, Value, Forecast, Companies, Trends, Industry, Outlook & Analysis
Market Forecast By Source (Marine, Inland, Freshwater), By Application (Food, Feed, Biomedical, Others), By Processing (Frozen, Preserved, Others), By Equipment (Gutting, Scaling, Filleting, Deboning, Skinning, Curing & Smoking, Others) And Competitive Landscape
| Product Code: ETC042635 | Publication Date: Jan 2021 | Updated Date: Jun 2026 | Product Type: Report | |
| Publisher: 6Wresearch | Author: Sachin Kumar Rai | No. of Pages: 70 | No. of Figures: 35 | No. of Tables: 5 |
Tanzania Fish Processing Market Summary
The tanzania fish processing market was estimated at USD 438 Million in 2025 and is projected to reach USD 595 Million by 2032, growing at a CAGR of 5.1% from 2026 to 2032.
Tanzania Fish Processing Market Growth Rate Analysis (2021-2032)
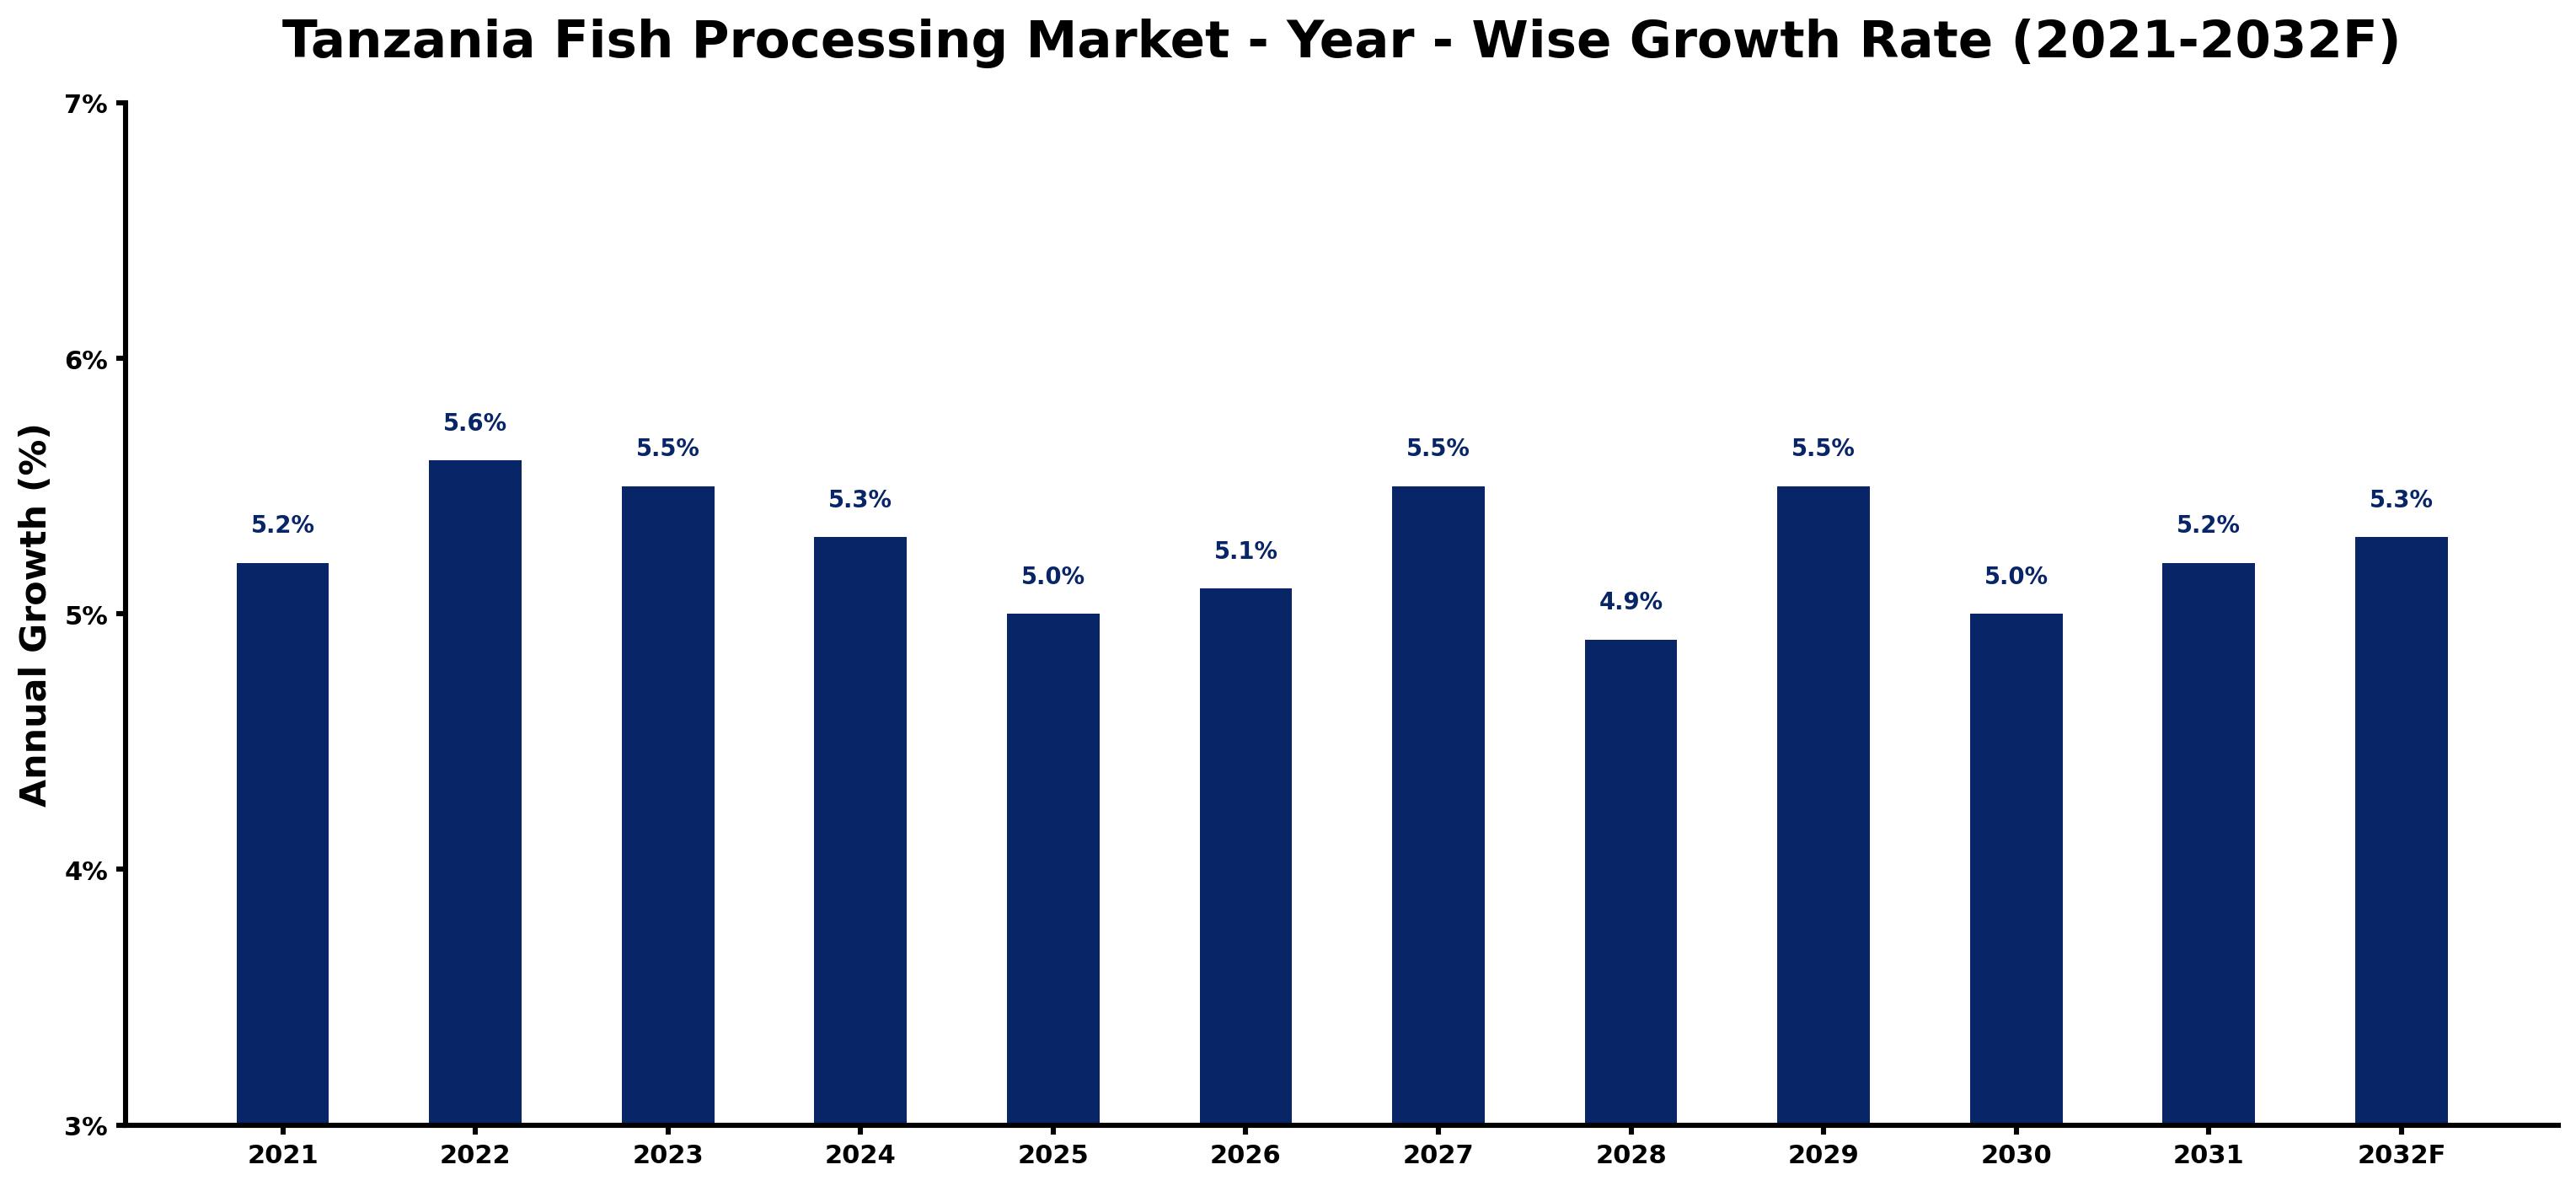
The Tanzania fish processing market is projected to experience steady growth over the coming years, with a notable increase of 5.2% in 2021, followed by 5.6% in 2022. This expansion can be attributed to rising consumer demand for seafood, coupled with enhanced investment in processing technologies and infrastructure. Growth remains stable with 5.5% in 2023, as operators adapt to evolving market preferences and sustainability pressures. However, projections indicate a slight dip to 5.0% by 2025, likely due to resource limitations and regulatory adjustments impacting raw material availability. By 2029, a resurgence is expected at 5.5%, driven by improved logistics and energy transition initiatives promoting more efficient operations in this vital sector.
Tanzania Fish Processing Market Year-wise Growth Rate and Key Drivers
This graph highlights how the Tanzania Fish Processing Market has steadily grown over the past five years, supported by major growth factors.
The table below presents the year wise growth rates along with the key drivers influencing the market
| Year | Growth Rate | Major Drivers |
| 2021 | 5.2% | Tanzania's abundant freshwater resources provide a solid foundation for fish farming expansion. |
| 2022 | 5.6% | Increased local demand for processed seafood boosts investment in processing technologies. |
| 2023 | 5.5% | Emerging export opportunities attract foreign investment in fish processing and logistics. |
| 2024 | 5.3% | Infrastructure improvements enhance cold chain logistics for fresh fish distribution. |
| 2025 | 5.0% | Sustainable fishing practices gain traction, leading to higher quality product offerings. |
| 2026 | 5.1% | Consumer preferences shift towards healthier protein sources, highlighting fish consumption growth. |
| 2027 | 5.5% | Collaborations between government and private sector encourage innovation in fish processing methods. |
| 2028 | 4.9% | Technological advancements in processing equipment reduce operational costs for local businesses. |
| 2029 | 5.5% | Increased access to training programs enhances workforce skills in fish processing techniques. |
| 2030 | 5.0% | Regional trade agreements simplify export processes, boosting fish product availability abroad. |
| 2031 | 5.2% | Consumer awareness campaigns elevate the profile of locally sourced fish products. |
| 2032 | 5.3% | Growing interest in aquaculture sustainability attracts new investments into the sector. |
Note - Market size estimations and growth projections presented in this report are based on 6Wresearch's advanced forecasting approach, validated with industry datasets as of June 2026.
Tanzania Fish Processing Market Synopsis
The Tanzania Fish Processing Market is projected to reach 5.1% and witness significant growth during the forecast period (2026-2032). This growth is propelled by increasing demand for processed fish products as a result of population expansion, rising disposable incomes, and evolving dietary preferences among consumers. The market is primarily characterized by a plethora of small-scale fish processors who engage in various activities such as filleting, smoking, salting, and canning, thereby catering to both local and export demands. Government interventions aimed at promoting fish processing activities and enhancing infrastructure have played a crucial role in ensuring compliance with food safety regulations, further contributing to the market's growth dynamics.
Tanzania Fish Processing Market Growth Drivers
Several key factors are driving the growth of the Tanzania Fish Processing Market. Firstly, increased population growth is significantly augmenting the demand for protein-rich food sources like fish. Secondly, a shift in consumer preferences towards processed fish products that offer convenience and ready-to-cook options has been observed. This is complemented by rising disposable incomes, allowing a larger segment of the population to purchase higher-value products. Furthermore, government initiatives to improve fish processing infrastructure and enforce food safety standards are facilitating industry growth. Lastly, the growing trend towards sustainability in fishing practices is influencing market dynamics as consumers become more conscious of environmental issues.
Tanzania Fish Processing Market Trends and Opportunities
The Tanzania Fish Processing Market is witnessing significant trends that indicate evolving consumer preferences and technological advancements. There is an increasing demand for value-added fish products, such as fillets and smoked fish, driven by changing dietary habits favoring convenience. The surge in health consciousness among consumers is also propelling interest in seafood products rich in omega-3 fatty acids. Moreover, investments in modern technology are enhancing processing efficiency and product quality, thus aligning with international standards. The emergence of partnerships between fish processors and retailers is expanding distribution networks, reaching broader customer bases and enhancing market penetration. Overall, these trends present substantial opportunities for investment, particularly in developing sustainable and innovative products.
Tanzania Fish Processing Market Challenges and Restraints
Despite the growth potential, the Tanzania Fish Processing Market is faced with several challenges that may impede its progress. Inadequate processing facilities impede operational efficiency, while a lack of modern technology restricts advancements within the sector. Additionally, the inconsistent supply of high-quality raw materials poses a significant barrier to maintaining product quality. Access to capital for upgrading processing capabilities remains limited, which further hinders investments in this crucial industry. Lastly, competition from imported processed fish products, coupled with stringent regulatory requirements, adds complexity to the market landscape that industry players must navigate.
Tanzania Fish Processing Market Investment Opportunities
Investment opportunities within the Tanzania Fish Processing Market are manifold, particularly given the country's rich marine resources and the increasing demand for processed fish. There is a substantial opportunity to establish modern fish processing facilities equipped with advanced technologies that can enhance productivity and output quality. Additionally, investing in the production of value-added fish products, including ready-to-eat meals and snacks, can be strategically advantageous. Collaborations with local fishing communities to secure a stable supply of raw materials present further investment avenues. Overall, these opportunities provide a robust framework for investors looking to capitalize on the growing market for processed fish in both domestic and international spheres.
Tanzania Fish Processing Market Government Investment and Initiatives
The Tanzanian government has launched various policies aimed at promoting growth within the fish processing sector. A significant focus has been on sustainability, with regulations implemented to safeguard marine resources and ensure responsible fishing practices. The government also emphasizes quality control measures to maintain high standards for processed fish, particularly for export markets. Additionally, incentives for value addition activities such as processing and packaging are being offered to encourage economic growth in the sector. Efforts to improve infrastructure within the industry, supported by public spending, are integral to enhancing the overall efficiency and competitiveness of the market, balancing economic development with environmental conservation.
Tanzania Fish Processing Market Latest Developments (May 2025 - June 2026)
Recent developments within the Tanzania Fish Processing Market from May 2025 to June 2026 showcase a sector in transition. Industry stakeholders are increasingly focusing on sustainable practices in processing and sourcing, reflecting rising consumer demand for environmentally friendly products. Technological advancements are being adopted to streamline processing methods, thus enhancing product quality and safety. Additionally, partnerships are gaining traction between local processors and larger retail outlets, facilitating wider distribution and market access. Government support mechanisms continue to evolve, ensuring compliance with international standards and addressing challenges faced by processors regarding infrastructure and technology.
Tanzania Fish Processing Market - Key Attractiveness of the Report
- 10 Years of Market Numbers
- Historical Data Starting from 2022 to 2025
- Base Year: 2025
- Forecast Data until 2032
- Key Performance Indicators Impacting the Market
- Major Upcoming Developments and Projects
Key Highlights of the Report:
- Tanzania Fish Processing Market Outlook
- Market Size of Tanzania Fish Processing Market, 2025
- Forecast of Tanzania Fish Processing Market, 2032F
- Historical Data and Forecast of Tanzania Fish Processing Revenues & Volume for the Period 2022-2032F
- Tanzania Fish Processing Market Trend Evolution
- Tanzania Fish Processing Market Drivers and Challenges
- Tanzania Fish Processing Price Trends
- Tanzania Fish Processing Porter's Five Forces
- Tanzania Fish Processing Industry Life Cycle
- Historical Data and Forecast of Tanzania Fish Processing Market Revenues & Volume By Source for the Period 2022-2032F
- Historical Data and Forecast of Tanzania Fish Processing Market Revenues & Volume By Marine for the Period 2022-2032F
- Historical Data and Forecast of Tanzania Fish Processing Market Revenues & Volume By Inland for the Period 2022-2032F
- Historical Data and Forecast of Tanzania Fish Processing Market Revenues & Volume By Freshwater for the Period 2022-2032F
- Historical Data and Forecast of Tanzania Fish Processing Market Revenues & Volume By Application for the Period 2022-2032F
- Historical Data and Forecast of Tanzania Fish Processing Market Revenues & Volume By Food for the Period 2022-2032F
- Historical Data and Forecast of Tanzania Fish Processing Market Revenues & Volume By Feed for the Period 2022-2032F
- Historical Data and Forecast of Tanzania Fish Processing Market Revenues & Volume By Biomedical for the Period 2022-2032F
- Historical Data and Forecast of Tanzania Fish Processing Market Revenues & Volume By Others for the Period 2022-2032F
- Historical Data and Forecast of Tanzania Fish Processing Market Revenues & Volume By Processing for the Period 2022-2032F
- Historical Data and Forecast of Tanzania Fish Processing Market Revenues & Volume By Frozen for the Period 2022-2032F
- Historical Data and Forecast of Tanzania Fish Processing Market Revenues & Volume By Preserved for the Period 2022-2032F
- Historical Data and Forecast of Tanzania Fish Processing Market Revenues & Volume By Others for the Period 2022-2032F
- Historical Data and Forecast of Tanzania Fish Processing Market Revenues & Volume By Equipment for the Period 2022-2032F
- Historical Data and Forecast of Tanzania Fish Processing Market Revenues & Volume By Gutting for the Period 2022-2032F
- Historical Data and Forecast of Tanzania Fish Processing Market Revenues & Volume By Scaling for the Period 2022-2032F
- Historical Data and Forecast of Tanzania Fish Processing Market Revenues & Volume By Filleting for the Period 2022-2032F
- Historical Data and Forecast of Tanzania Fish Processing Market Revenues & Volume By Deboning for the Period 2022-2032F
- Historical Data and Forecast of Tanzania Fish Processing Market Revenues & Volume By Skinning for the Period 2022-2032F
- Historical Data and Forecast of Tanzania Fish Processing Market Revenues & Volume By Curing & Smoking for the Period 2022-2032F
- Historical Data and Forecast of Tanzania Fish Processing Market Revenues & Volume By Others for the Period 2022-2032F
- Tanzania Fish Processing Import Export Trade Statistics
- Market Opportunity Assessment By Source
- Market Opportunity Assessment By Application
- Market Opportunity Assessment By Processing
- Market Opportunity Assessment By Equipment
- Tanzania Fish Processing Top Companies Market Share
- Tanzania Fish Processing Competitive Benchmarking By Technical and Operational Parameters
- Tanzania Fish Processing Company Profiles
- Tanzania Fish Processing Key Strategic Recommendations
Frequently Asked Questions About the Market Study (FAQs):
The growth of the Tanzania Fish Processing Market is driven by increasing population, rising disposable incomes, evolving consumer preferences towards convenience foods, and government initiatives aimed at enhancing processing capabilities and food safety standards.
Challenges include inadequate processing facilities, limited access to capital for modernization, inconsistent supply of quality raw materials, and competition from imported processed fish products, all of which affect overall industry efficiency.
Investors may find opportunities in establishing advanced fish processing facilities, producing value-added fish products, and partnering with local fishing communities to ensure a sustainable and reliable supply of raw materials.
The government supports the sector through regulations promoting sustainability, incentives for value addition, and investments aimed at improving infrastructure and quality control, thus fostering a conducive environment for growth.
6Wresearch actively monitors the Tanzania Fish Processing Market and publishes its comprehensive annual report, highlighting emerging trends, growth drivers, revenue analysis, and forecast outlook. Our insights help businesses to make data-backed strategic decisions with ongoing market dynamics. Our analysts track relevent industries related to the Tanzania Fish Processing Market, allowing our clients with actionable intelligence and reliable forecasts tailored to emerging regional needs.
Yes, we provide customisation as per your requirements. To learn more, feel free to contact us on sales@6wresearch.com
1 Executive Summary |
2 Introduction |
2.1 Key Highlights of the Report |
2.2 Report Description |
2.3 Market Scope & Segmentation |
2.4 Research Methodology |
2.5 Assumptions |
3 Tanzania Fish Processing Market Overview |
3.1 Tanzania Country Macro Economic Indicators |
3.2 Tanzania Fish Processing Market Revenues & Volume, 2022 & 2032F |
3.3 Tanzania Fish Processing Market - Industry Life Cycle |
3.4 Tanzania Fish Processing Market - Porter's Five Forces |
3.5 Tanzania Fish Processing Market Revenues & Volume Share, By Source, 2022 & 2032F |
3.6 Tanzania Fish Processing Market Revenues & Volume Share, By Application, 2022 & 2032F |
3.7 Tanzania Fish Processing Market Revenues & Volume Share, By Processing, 2022 & 2032F |
3.8 Tanzania Fish Processing Market Revenues & Volume Share, By Equipment, 2022 & 2032F |
4 Tanzania Fish Processing Market Dynamics |
4.1 Impact Analysis |
4.2 Market Drivers |
4.3 Market Restraints |
5 Tanzania Fish Processing Market Trends |
6 Tanzania Fish Processing Market, By Types |
6.1 Tanzania Fish Processing Market, By Source |
6.1.1 Overview and Analysis |
6.1.2 Tanzania Fish Processing Market Revenues & Volume, By Source, 2022-2032F |
6.1.3 Tanzania Fish Processing Market Revenues & Volume, By Marine, 2022-2032F |
6.1.4 Tanzania Fish Processing Market Revenues & Volume, By Inland, 2022-2032F |
6.1.5 Tanzania Fish Processing Market Revenues & Volume, By Freshwater, 2022-2032F |
6.2 Tanzania Fish Processing Market, By Application |
6.2.1 Overview and Analysis |
6.2.2 Tanzania Fish Processing Market Revenues & Volume, By Food, 2022-2032F |
6.2.3 Tanzania Fish Processing Market Revenues & Volume, By Feed, 2022-2032F |
6.2.4 Tanzania Fish Processing Market Revenues & Volume, By Biomedical, 2022-2032F |
6.2.5 Tanzania Fish Processing Market Revenues & Volume, By Others, 2022-2032F |
6.3 Tanzania Fish Processing Market, By Processing |
6.3.1 Overview and Analysis |
6.3.2 Tanzania Fish Processing Market Revenues & Volume, By Frozen, 2022-2032F |
6.3.3 Tanzania Fish Processing Market Revenues & Volume, By Preserved, 2022-2032F |
6.3.4 Tanzania Fish Processing Market Revenues & Volume, By Others, 2022-2032F |
6.4 Tanzania Fish Processing Market, By Equipment |
6.4.1 Overview and Analysis |
6.4.2 Tanzania Fish Processing Market Revenues & Volume, By Gutting, 2022-2032F |
6.4.3 Tanzania Fish Processing Market Revenues & Volume, By Scaling, 2022-2032F |
6.4.4 Tanzania Fish Processing Market Revenues & Volume, By Filleting, 2022-2032F |
6.4.5 Tanzania Fish Processing Market Revenues & Volume, By Deboning, 2022-2032F |
6.4.6 Tanzania Fish Processing Market Revenues & Volume, By Skinning, 2022-2032F |
6.4.7 Tanzania Fish Processing Market Revenues & Volume, By Curing & Smoking, 2022-2032F |
7 Tanzania Fish Processing Market Import-Export Trade Statistics |
7.1 Tanzania Fish Processing Market Export to Major Countries |
7.2 Tanzania Fish Processing Market Imports from Major Countries |
8 Tanzania Fish Processing Market Key Performance Indicators |
9 Tanzania Fish Processing Market - Opportunity Assessment |
9.1 Tanzania Fish Processing Market Opportunity Assessment, By Source, 2022 & 2032F |
9.2 Tanzania Fish Processing Market Opportunity Assessment, By Application, 2022 & 2032F |
9.3 Tanzania Fish Processing Market Opportunity Assessment, By Processing, 2022 & 2032F |
9.4 Tanzania Fish Processing Market Opportunity Assessment, By Equipment, 2022 & 2032F |
10 Tanzania Fish Processing Market - Competitive Landscape |
10.1 Tanzania Fish Processing Market Revenue Share, By Companies, 2025 |
10.2 Tanzania Fish Processing Market Competitive Benchmarking, By Operating and Technical Parameters |
11 Company Profiles |
12 Recommendations |
13 Disclaimer |
Global Go To Market Strategy - 2030
Export potential enables firms to identify high-growth global markets with greater confidence by combining advanced trade intelligence with a structured quantitative methodology. The framework analyzes emerging demand trends and country-level import patterns while integrating macroeconomic and trade datasets such as GDP and population forecasts, bilateral import–export flows, tariff structures, elasticity differentials between developed and developing economies, geographic distance, and import demand projections. Using weighted trade values from 2020–2024 as the base period to project country-to-country export potential for 2030, these inputs are operationalized through calculated drivers such as gravity model parameters, tariff impact factors, and projected GDP per-capita growth. Through an analysis of hidden potentials, demand hotspots, and market conditions that are most favorable to success, this method enables firms to focus on target countries, maximize returns, and global expansion with data, backed by accuracy.
By factoring in the projected importer demand gap that is currently unmet and could be potential opportunity, it identifies the potential for the Exporter (Country) among 190 countries, against the general trade analysis, which identifies the biggest importer or exporter.
To discover high-growth global markets and optimize your business strategy:
Click Here
Pricing
- Single User License$ 1,995
- Department License$ 2,400
- Site License$ 3,120
- Global License$ 3,795

Leadership Perspectives from Industry Events
Search
Thought Leadership and Analyst Meet


Our Clients
6WResearch In News
- India Air Conditioner Market Set for Strong Rebound in 2026 After Weather-Led Correction and GST-Driven Recovery: 6Wresearch
- ADAS in India: How Automatic Emergency Braking, Blind Spot Detection & Driver Monitoring are Transforming Road Safety
- Doha a strategic location for EV manufacturing hub: IPA Qatar
- Demand for luxury TVs surging in the GCC, says Samsung
- Empowering Growth: The Thriving Journey of Bangladesh’s Cable Industry
- Demand for luxury TVs surging in the GCC, says Samsung
Latest Reports
- Poland Fire Protection Systems Market (2026-2032)
- Cape Verde Portable Hand-Thrown Extinguisher Market (2026-2032)
- Canada Portable Hand-Thrown Extinguisher Market (2026-2032)
- Cameroon Portable Hand-Thrown Extinguisher Market (2026-2032)
- Burundi Portable Hand-Thrown Extinguisher Market (2026-2032)
- Burkina Faso Portable Hand-Thrown Extinguisher Market (2026-2032)
- Bulgaria Portable Hand-Thrown Extinguisher Market (2026-2032)
- Brunei Portable Hand-Thrown Extinguisher Market (2026-2032)
- Botswana Portable Hand-Thrown Extinguisher Market (2026-2032)
- Bosnia and Herzegovina Portable Hand-Thrown Extinguisher Market (2026-2032)
Industry Events and Analyst Meet

HIMTEX 2026

India Refining Summit 2026

India EV Show 2026

EV tech India Expo 2026

Auto Tech Asia 2026
Whitepaper
- Middle East & Africa Commercial Security Market Click here to view more.
- Middle East & Africa Fire Safety Systems & Equipment Market Click here to view more.
- GCC Drone Market Click here to view more.
- Middle East Lighting Fixture Market Click here to view more.
- GCC Physical & Perimeter Security Market Click here to view more.