Tanzania Rubber Market (2026-2032) | Trends, Size, Share, Value, Companies, Revenue, Analysis, Forecast, Growth, Industry & Outlook
Market Forecast By Product Type (Natural Rubber, Synthetic Rubber), By End-users (Automotive & Transportation, Building & Construction, Industrial Machinery & Equipment, Others) And Competitive Landscape
| Product Code: ETC037836 | Publication Date: Jan 2021 | Updated Date: Jun 2026 | Product Type: Report | |
| Publisher: 6Wresearch | Author: Bhawna Singh | No. of Pages: 70 | No. of Figures: 35 | No. of Tables: 5 |
Tanzania Rubber Market Summary
The tanzania rubber market was estimated at USD 1156 Million in 2025 and is projected to reach USD 1653 Million by 2032, growing at a CAGR of 6.1% from 2026 to 2032.
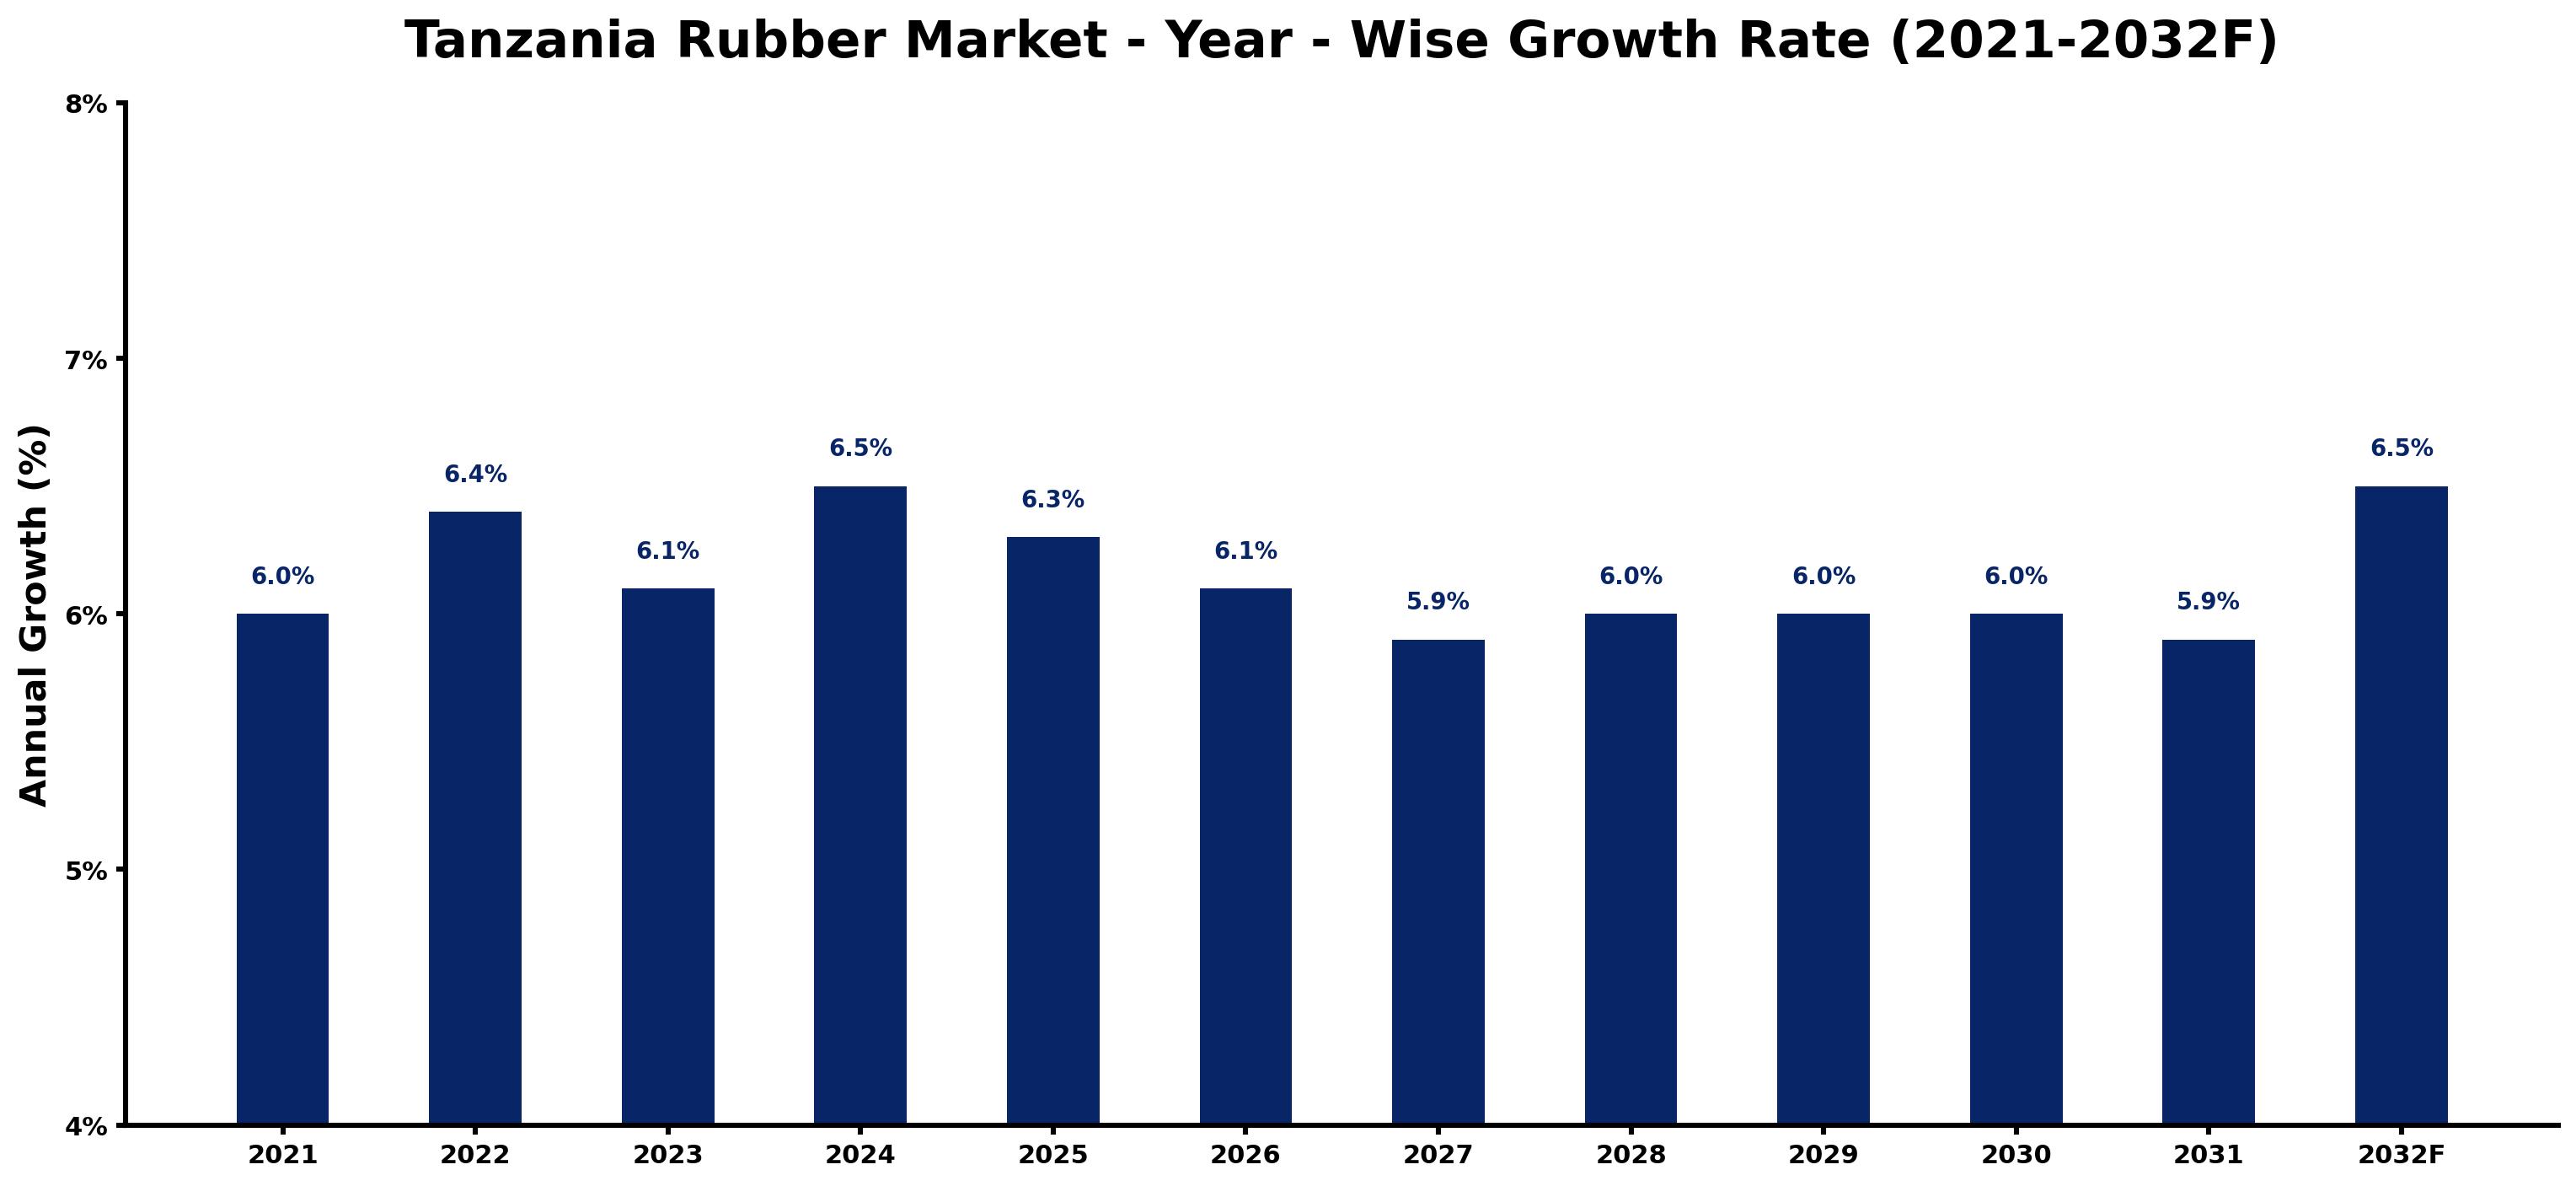
Tanzania Rubber Market Growth Rate Analysis (2021-2032)
The Tanzania rubber market has displayed stable growth, marked by a yearly increase between 6.0% and 6.5% from 2021 through 2032. In 2021, growth was at 6.0%, with a slight rise to 6.4% in 2022 fueled by heightened consumer demand and investments in sustainable rubber production practices. Although growth dipped to 6.1% in 2023, it rebounded to 6.5% in 2024, underpinned by advancements in processing technology and infrastructure improvements. While fluctuations are notable, with a slight slow down to 5.9% by 2031, the market is expected to stabilize at around 6.0% through 2030. Continued emphasis on eco-friendly production methods and energy transition policies further supports the market's resilience.
Tanzania Rubber Market Year-wise Growth Rate and Key Drivers
This graph highlights how the Tanzania Rubber Market has steadily grown over the past five years, supported by major growth factors.
The table below presents the year wise growth rates along with the key drivers influencing the market
| Year | Growth Rate | Major Drivers |
| 2021 | 6.0% | COVID-19 disruptions highlighted vulnerabilities in supply chains, prompting local sourcing strategies. |
| 2022 | 6.4% | Investments in rubber processing facilities improved efficiency and reduced reliance on imports. |
| 2023 | 6.1% | Increased awareness of sustainable rubber production attracted eco-conscious investors and consumers. |
| 2024 | 6.5% | Global tire manufacturers expanded operations in Tanzania, boosting the local rubber economy. |
| 2025 | 6.3% | Economic diversification initiatives encouraged farmers to integrate rubber cultivation into crop rotations. |
| 2026 | 6.1% | Emerging e-commerce platforms facilitated direct connections between farmers and buyers, enhancing sales. |
| 2027 | 5.9% | Research partnerships with universities fostered innovation in rubber cultivation and processing techniques. |
| 2028 | 6.0% | Infrastructure improvements, particularly in transportation, lowered costs and enhanced market access. |
| 2029 | 6.0% | Climate resilience initiatives helped farmers adapt to environmental changes affecting rubber yields. |
| 2030 | 6.0% | Consumer preferences shifted toward natural materials, increasing the demand for sustainably sourced rubber. |
| 2031 | 5.9% | Regional trade agreements expanded market access for Tanzanian rubber producers in neighboring countries. |
| 2032 | 6.5% | Technological adoption in precision agriculture maximized rubber tree productivity and profitability. |
Note - Market size estimations and growth projections presented in this report are based on 6Wresearch's advanced forecasting approach, validated with industry datasets as of June 2026.
Tanzania Rubber Market Synopsis
The Tanzania Rubber Market is projected to reach 6.1% and witness significant growth during the forecast period (2026-2032). This growth is attributed to rising demand from key industries such as automotive, construction, and healthcare. The optimal climate and fertile soil in Tanzania have facilitated the production of high-quality natural rubber, primarily sourced from smallholder farmers. Government initiatives play a pivotal role in enhancing productivity and boosting the sector's potential, despite existing challenges related to processing infrastructure.
Tanzania Rubber Market Growth Drivers
The growth trajectory of the Tanzania Rubber Market can be attributed to several interrelated factors:
- The automotive sector's increasing reliance on rubber for tires and components is a significant driver, as vehicle production continues to grow within the region.
- Infrastructure development projects throughout Tanzania are spurring demand for rubber in construction materials, particularly in roadworks and building projects.
- Healthcare advancements are generating higher needs for rubber in medical supplies, emphasizing the importance of quality natural rubber in producing safe and reliable health-related products.
- Growing consumer preference for sustainable and eco-friendly products is steering the market towards organic and Fair Trade-certified rubber, aligning with global sustainability trends.
- Technological innovations in rubber processing are enhancing efficiency and product quality, creating new opportunities for market players to meet evolving consumer demands.
Tanzania Rubber Market Trends and Opportunities
The Tanzania Rubber Market exhibits several notable trends that highlight potential opportunities for stakeholders:
- The increasing emphasis on sustainable practices is prompting investments in organic rubber production, appealing to environmentally conscious consumers and businesses.
- Investment in research and development is crucial for improving yield and quality, with a focus on adopting modern agricultural techniques.
- The expansion of rubber processing facilities is necessary to add value to raw rubber and meet both domestic and international demand effectively.
- Enhanced market transparency and access to information can empower smallholder farmers, enabling them to make informed decisions about production and marketing.
- The global shift towards green technologies is increasing the demand for natural rubber, positioning Tanzania as a potential supplier for eco-friendly products.
Tanzania Rubber Market Challenges and Restraints
Despite the promising outlook, the Tanzania Rubber Market faces several challenges that could impede progress:
- Inadequate infrastructure for both cultivation and processing remains a significant barrier, limiting the sector's ability to meet growing demand efficiently.
- Climate variability poses risks to rubber production, as fluctuations can affect crop yields and supply consistency.
- Access to modern technologies is insufficient, hindering the ability of smallholders to adopt best practices in rubber production and processing.
- Lack of comprehensive market information creates challenges in supply chain management, making it difficult for farmers to align production with market needs.
- Competition from synthetic rubber products is intensifying, necessitating a robust strategy for promoting the unique advantages of natural rubber.
Tanzania Rubber Market Government Investment and Initiatives
The Tanzanian government has established several initiatives to bolster the rubber sector:
- Subsidies and incentives directed towards smallholder farmers aim to encourage rubber cultivation and increase production capacity.
- Technical assistance programs provide essential resources for farmers, enabling them to adopt modern cultivation and processing techniques.
- Efforts to enhance regulatory frameworks ensure adherence to quality control measures, thus promoting higher standards in rubber production.
- Investment in expanding processing capacities is a focal point, as this can significantly increase value addition and domestic consumption of rubber products.
- Public spending on agricultural development projects is expected to create employment opportunities, contributing to the overall economic development of the rubber industry.
Tanzania Rubber Market Latest Developments (May 2025 - June 2026)
Recent developments within the Tanzania Rubber Market indicate a shift towards enhancing production and processing capabilities. During this period, there have been observable efforts to modernize processing facilities to better accommodate rising domestic and international demand. Furthermore, various workshops and training sessions aimed at educating smallholder farmers about sustainable production practices have become increasingly common. Government initiatives to attract foreign investment have gained traction, with negotiations exploring potential partnerships to bolster the sector. Additionally, the growing trend towards eco-friendly rubber products has encouraged several stakeholders to explore organic certification and sustainable agricultural practices, showcasing a commitment to aligning with global sustainability trends.
Tanzania Rubber Market Future Outlook
Looking ahead, the Tanzania Rubber Market is set for a period of steady growth between 2026 and 2032. Fuelled by infrastructural enhancements and increasing economic activity, the demand for rubber products is expected to expand significantly. The government's ongoing focus on agricultural improvement and investment in processing capabilities will likely facilitate higher production levels. Nonetheless, challenges such as fluctuating global rubber prices and climate change impacts demand strategic navigation. Overall, with targeted investments in technology and sustainability, the Tanzania Rubber Market holds promise for substantial contributions to the national economy moving forward.
Tanzania Rubber Market - Key Attractiveness of the Report
- 10 Years of Market Numbers
- Historical Data Starting from 2022 to 2025
- Base Year: 2025
- Forecast Data until 2032
- Key Performance Indicators Impacting the Market
- Major Upcoming Developments and Projects
Key Highlights of the Report:
- Tanzania Rubber Market Outlook
- Market Size of Tanzania Rubber Market, 2025
- Forecast of Tanzania Rubber Market, 2032F
- Historical Data and Forecast of Tanzania Rubber Revenues & Volume for the Period 2022-2032F
- Tanzania Rubber Market Trend Evolution
- Tanzania Rubber Market Drivers and Challenges
- Tanzania Rubber Price Trends
- Tanzania Rubber Porter's Five Forces
- Tanzania Rubber Industry Life Cycle
- Historical Data and Forecast of Tanzania Rubber Market Revenues & Volume By Product Type for the Period 2022-2032F
- Historical Data and Forecast of Tanzania Rubber Market Revenues & Volume By Natural Rubber for the Period 2022-2032F
- Historical Data and Forecast of Tanzania Rubber Market Revenues & Volume By Synthetic Rubber for the Period 2022-2032F
- Historical Data and Forecast of Tanzania Rubber Market Revenues & Volume By End-users for the Period 2022-2032F
- Historical Data and Forecast of Tanzania Rubber Market Revenues & Volume By Automotive & Transportation for the Period 2022-2032F
- Historical Data and Forecast of Tanzania Rubber Market Revenues & Volume By Building & Construction for the Period 2022-2032F
- Historical Data and Forecast of Tanzania Rubber Market Revenues & Volume By Industrial Machinery & Equipment for the Period 2022-2032F
- Historical Data and Forecast of Tanzania Rubber Market Revenues & Volume By Others for the Period 2022-2032F
- Tanzania Rubber Import Export Trade Statistics
- Market Opportunity Assessment By Product Type
- Market Opportunity Assessment By End-users
- Tanzania Rubber Top Companies Market Share
- Tanzania Rubber Competitive Benchmarking By Technical and Operational Parameters
- Tanzania Rubber Company Profiles
- Tanzania Rubber Key Strategic Recommendations
Frequently Asked Questions About the Market Study (FAQs):
The market is expected to experience steady growth due to increasing demand across various sectors, underpinned by government support and favorable climatic conditions.
Smallholder farmers are central to the production of rubber in Tanzania, and their involvement is crucial for the sector's ongoing growth and sustainability.
Key challenges include inadequate infrastructure, inconsistent supply due to climatic variability, and competition from synthetic rubber alternatives.
Government policies aim to encourage rubber cultivation, improve processing capacities, and attract investments, thereby fostering sector growth and sustainable practices.
6Wresearch actively monitors the Tanzania Rubber Market and publishes its comprehensive annual report, highlighting emerging trends, growth drivers, revenue analysis, and forecast outlook. Our insights help businesses to make data-backed strategic decisions with ongoing market dynamics. Our analysts track relevent industries related to the Tanzania Rubber Market, allowing our clients with actionable intelligence and reliable forecasts tailored to emerging regional needs.
Yes, we provide customisation as per your requirements. To learn more, feel free to contact us on sales@6wresearch.com
1 Executive Summary |
2 Introduction |
2.1 Key Highlights of the Report |
2.2 Report Description |
2.3 Market Scope & Segmentation |
2.4 Research Methodology |
2.5 Assumptions |
3 Tanzania Rubber Market Overview |
3.1 Tanzania Country Macro Economic Indicators |
3.2 Tanzania Rubber Market Revenues & Volume, 2022 & 2032F |
3.3 Tanzania Rubber Market - Industry Life Cycle |
3.4 Tanzania Rubber Market - Porter's Five Forces |
3.5 Tanzania Rubber Market Revenues & Volume Share, By Product Type, 2022 & 2032F |
3.6 Tanzania Rubber Market Revenues & Volume Share, By End-users, 2022 & 2032F |
4 Tanzania Rubber Market Dynamics |
4.1 Impact Analysis |
4.2 Market Drivers |
4.3 Market Restraints |
5 Tanzania Rubber Market Trends |
6 Tanzania Rubber Market, By Types |
6.1 Tanzania Rubber Market, By Product Type |
6.1.1 Overview and Analysis |
6.1.2 Tanzania Rubber Market Revenues & Volume, By Product Type, 2022-2032F |
6.1.3 Tanzania Rubber Market Revenues & Volume, By Natural Rubber, 2022-2032F |
6.1.4 Tanzania Rubber Market Revenues & Volume, By Synthetic Rubber, 2022-2032F |
6.2 Tanzania Rubber Market, By End-users |
6.2.1 Overview and Analysis |
6.2.2 Tanzania Rubber Market Revenues & Volume, By Automotive & Transportation, 2022-2032F |
6.2.3 Tanzania Rubber Market Revenues & Volume, By Building & Construction, 2022-2032F |
6.2.4 Tanzania Rubber Market Revenues & Volume, By Industrial Machinery & Equipment, 2022-2032F |
6.2.5 Tanzania Rubber Market Revenues & Volume, By Others, 2022-2032F |
7 Tanzania Rubber Market Import-Export Trade Statistics |
7.1 Tanzania Rubber Market Export to Major Countries |
7.2 Tanzania Rubber Market Imports from Major Countries |
8 Tanzania Rubber Market Key Performance Indicators |
9 Tanzania Rubber Market - Opportunity Assessment |
9.1 Tanzania Rubber Market Opportunity Assessment, By Product Type, 2022 & 2032F |
9.2 Tanzania Rubber Market Opportunity Assessment, By End-users, 2022 & 2032F |
10 Tanzania Rubber Market - Competitive Landscape |
10.1 Tanzania Rubber Market Revenue Share, By Companies, 2025 |
10.2 Tanzania Rubber Market Competitive Benchmarking, By Operating and Technical Parameters |
11 Company Profiles |
12 Recommendations |
13 Disclaimer |
Global Go To Market Strategy - 2030
Export potential enables firms to identify high-growth global markets with greater confidence by combining advanced trade intelligence with a structured quantitative methodology. The framework analyzes emerging demand trends and country-level import patterns while integrating macroeconomic and trade datasets such as GDP and population forecasts, bilateral import–export flows, tariff structures, elasticity differentials between developed and developing economies, geographic distance, and import demand projections. Using weighted trade values from 2020–2024 as the base period to project country-to-country export potential for 2030, these inputs are operationalized through calculated drivers such as gravity model parameters, tariff impact factors, and projected GDP per-capita growth. Through an analysis of hidden potentials, demand hotspots, and market conditions that are most favorable to success, this method enables firms to focus on target countries, maximize returns, and global expansion with data, backed by accuracy.
By factoring in the projected importer demand gap that is currently unmet and could be potential opportunity, it identifies the potential for the Exporter (Country) among 190 countries, against the general trade analysis, which identifies the biggest importer or exporter.
To discover high-growth global markets and optimize your business strategy:
Click Here
Pricing
- Single User License$ 1,995
- Department License$ 2,400
- Site License$ 3,120
- Global License$ 3,795

Leadership Perspectives from Industry Events
Search
Thought Leadership and Analyst Meet


Our Clients
6WResearch In News
- India Air Conditioner Market Set for Strong Rebound in 2026 After Weather-Led Correction and GST-Driven Recovery: 6Wresearch
- ADAS in India: How Automatic Emergency Braking, Blind Spot Detection & Driver Monitoring are Transforming Road Safety
- Doha a strategic location for EV manufacturing hub: IPA Qatar
- Demand for luxury TVs surging in the GCC, says Samsung
- Empowering Growth: The Thriving Journey of Bangladesh’s Cable Industry
- Demand for luxury TVs surging in the GCC, says Samsung
Latest Reports
- Poland Fire Protection Systems Market (2026-2032)
- Cape Verde Portable Hand-Thrown Extinguisher Market (2026-2032)
- Canada Portable Hand-Thrown Extinguisher Market (2026-2032)
- Cameroon Portable Hand-Thrown Extinguisher Market (2026-2032)
- Burundi Portable Hand-Thrown Extinguisher Market (2026-2032)
- Burkina Faso Portable Hand-Thrown Extinguisher Market (2026-2032)
- Bulgaria Portable Hand-Thrown Extinguisher Market (2026-2032)
- Brunei Portable Hand-Thrown Extinguisher Market (2026-2032)
- Botswana Portable Hand-Thrown Extinguisher Market (2026-2032)
- Bosnia and Herzegovina Portable Hand-Thrown Extinguisher Market (2026-2032)
Industry Events and Analyst Meet

HIMTEX 2026

India Refining Summit 2026

India EV Show 2026

EV tech India Expo 2026

Auto Tech Asia 2026
Whitepaper
- Middle East & Africa Commercial Security Market Click here to view more.
- Middle East & Africa Fire Safety Systems & Equipment Market Click here to view more.
- GCC Drone Market Click here to view more.
- Middle East Lighting Fixture Market Click here to view more.
- GCC Physical & Perimeter Security Market Click here to view more.