Belgium Growler Market (2026-2032) | Growth, Competitive Landscape, Outlook, Value, Forecast, Trends, Share, Segmentation, Industry, Analysis, Size & Revenue, Companies
Market Forecast By Capacity Type (32Oz, 64Oz, 128Oz), By Application (Alcoholic Beverages, Beer, Wines, Others, Non-Alcoholic Beverages), By Material (Glass, Plastic, Metal, Ceramic), By Sales Channel (Online, Offline, Breweries, Hypermarket, Convenience Stores), By End User (Commercial, Residential) And Competitive Landscape
| Product Code: ETC6355007 | Publication Date: Sep 2024 | Updated Date: Apr 2026 | Product Type: Market Research Report | |
| Publisher: 6Wresearch | Author: Vasudha | No. of Pages: 75 | No. of Figures: 35 | No. of Tables: 20 |
Belgium Growler Market Size (2020-2030)
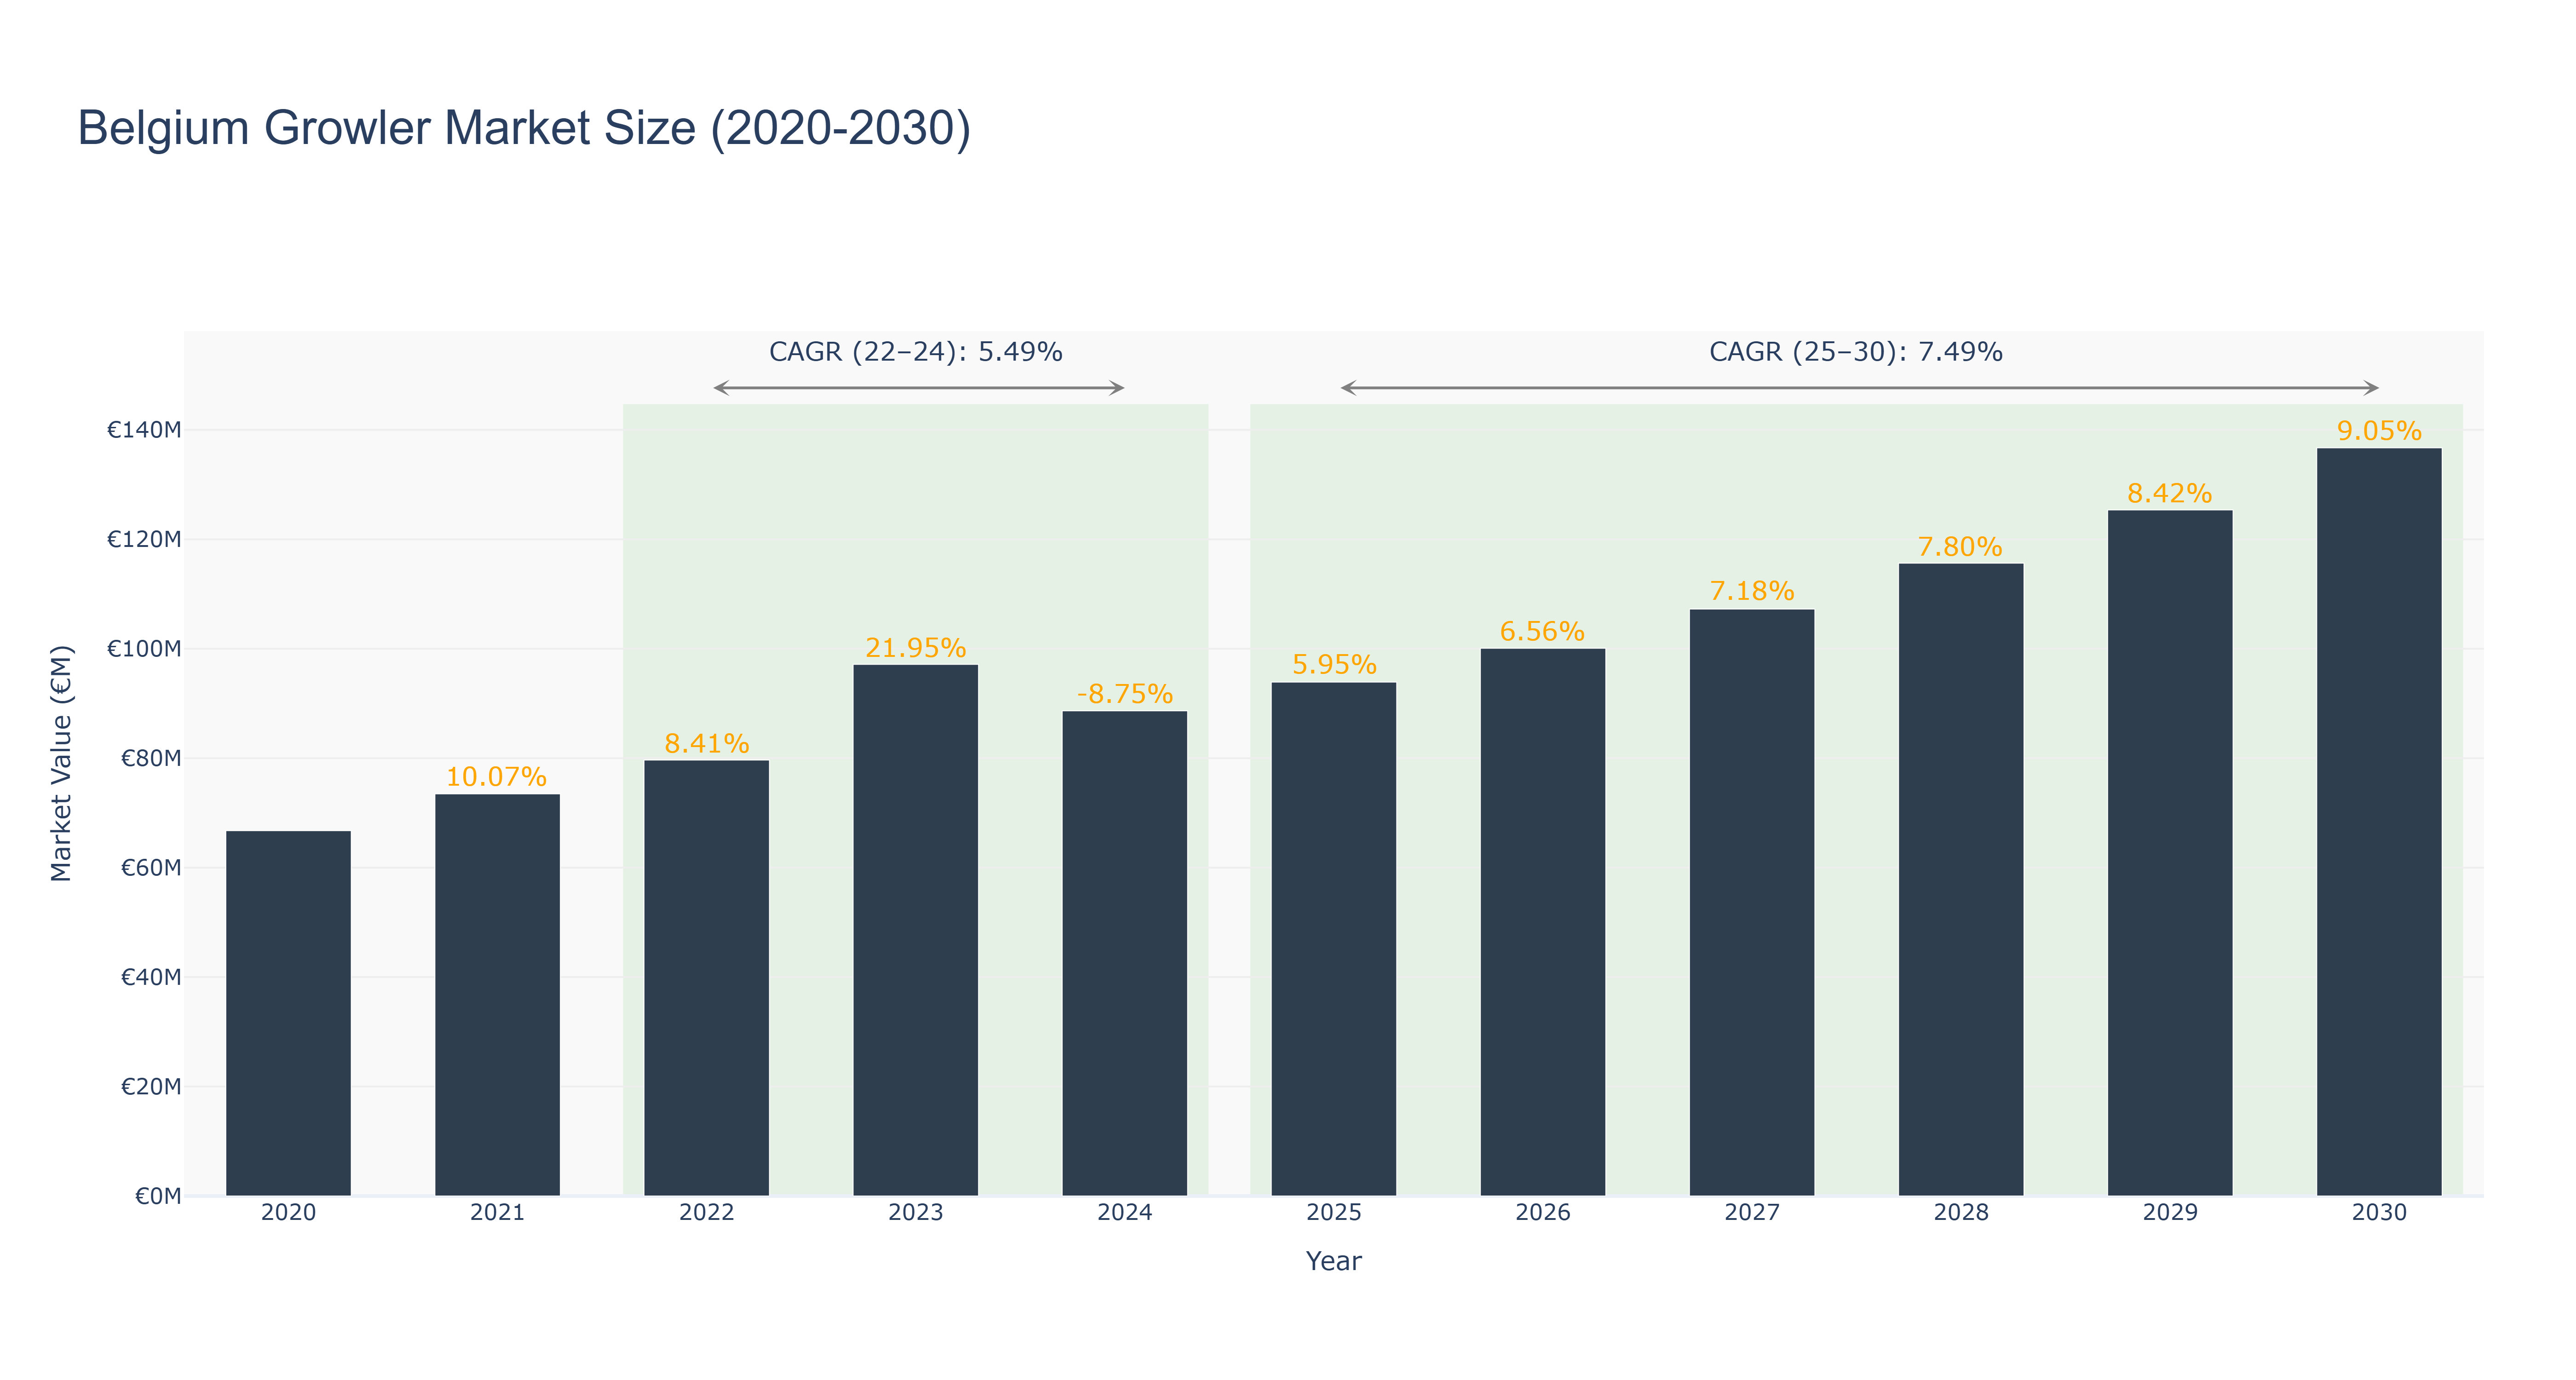
Belgium Growler Market has witnessed a fluctuating trend in market size over the years. The peak market size of €136.72 million is forecasted for 2030, showcasing a steady growth trajectory. The market experienced a decline from 2022 to 2024, attributed to various factors impacting consumer demand and economic conditions. However, from 2025 to 2030, a promising Compound Annual Growth Rate (CAGR) of 7.49% indicates a positive outlook for the market, driven by increasing consumer preferences and market expansion initiatives. Recent industry drivers such as innovative product offerings and growing consumer awareness are expected to fuel further growth. In the near future, upcoming sustainability projects in the beer industry are set to drive market growth by catering to environmentally conscious consumers and enhancing brand reputation.
Belgium Growler Market: Production & Trade Performance (2019-2025)
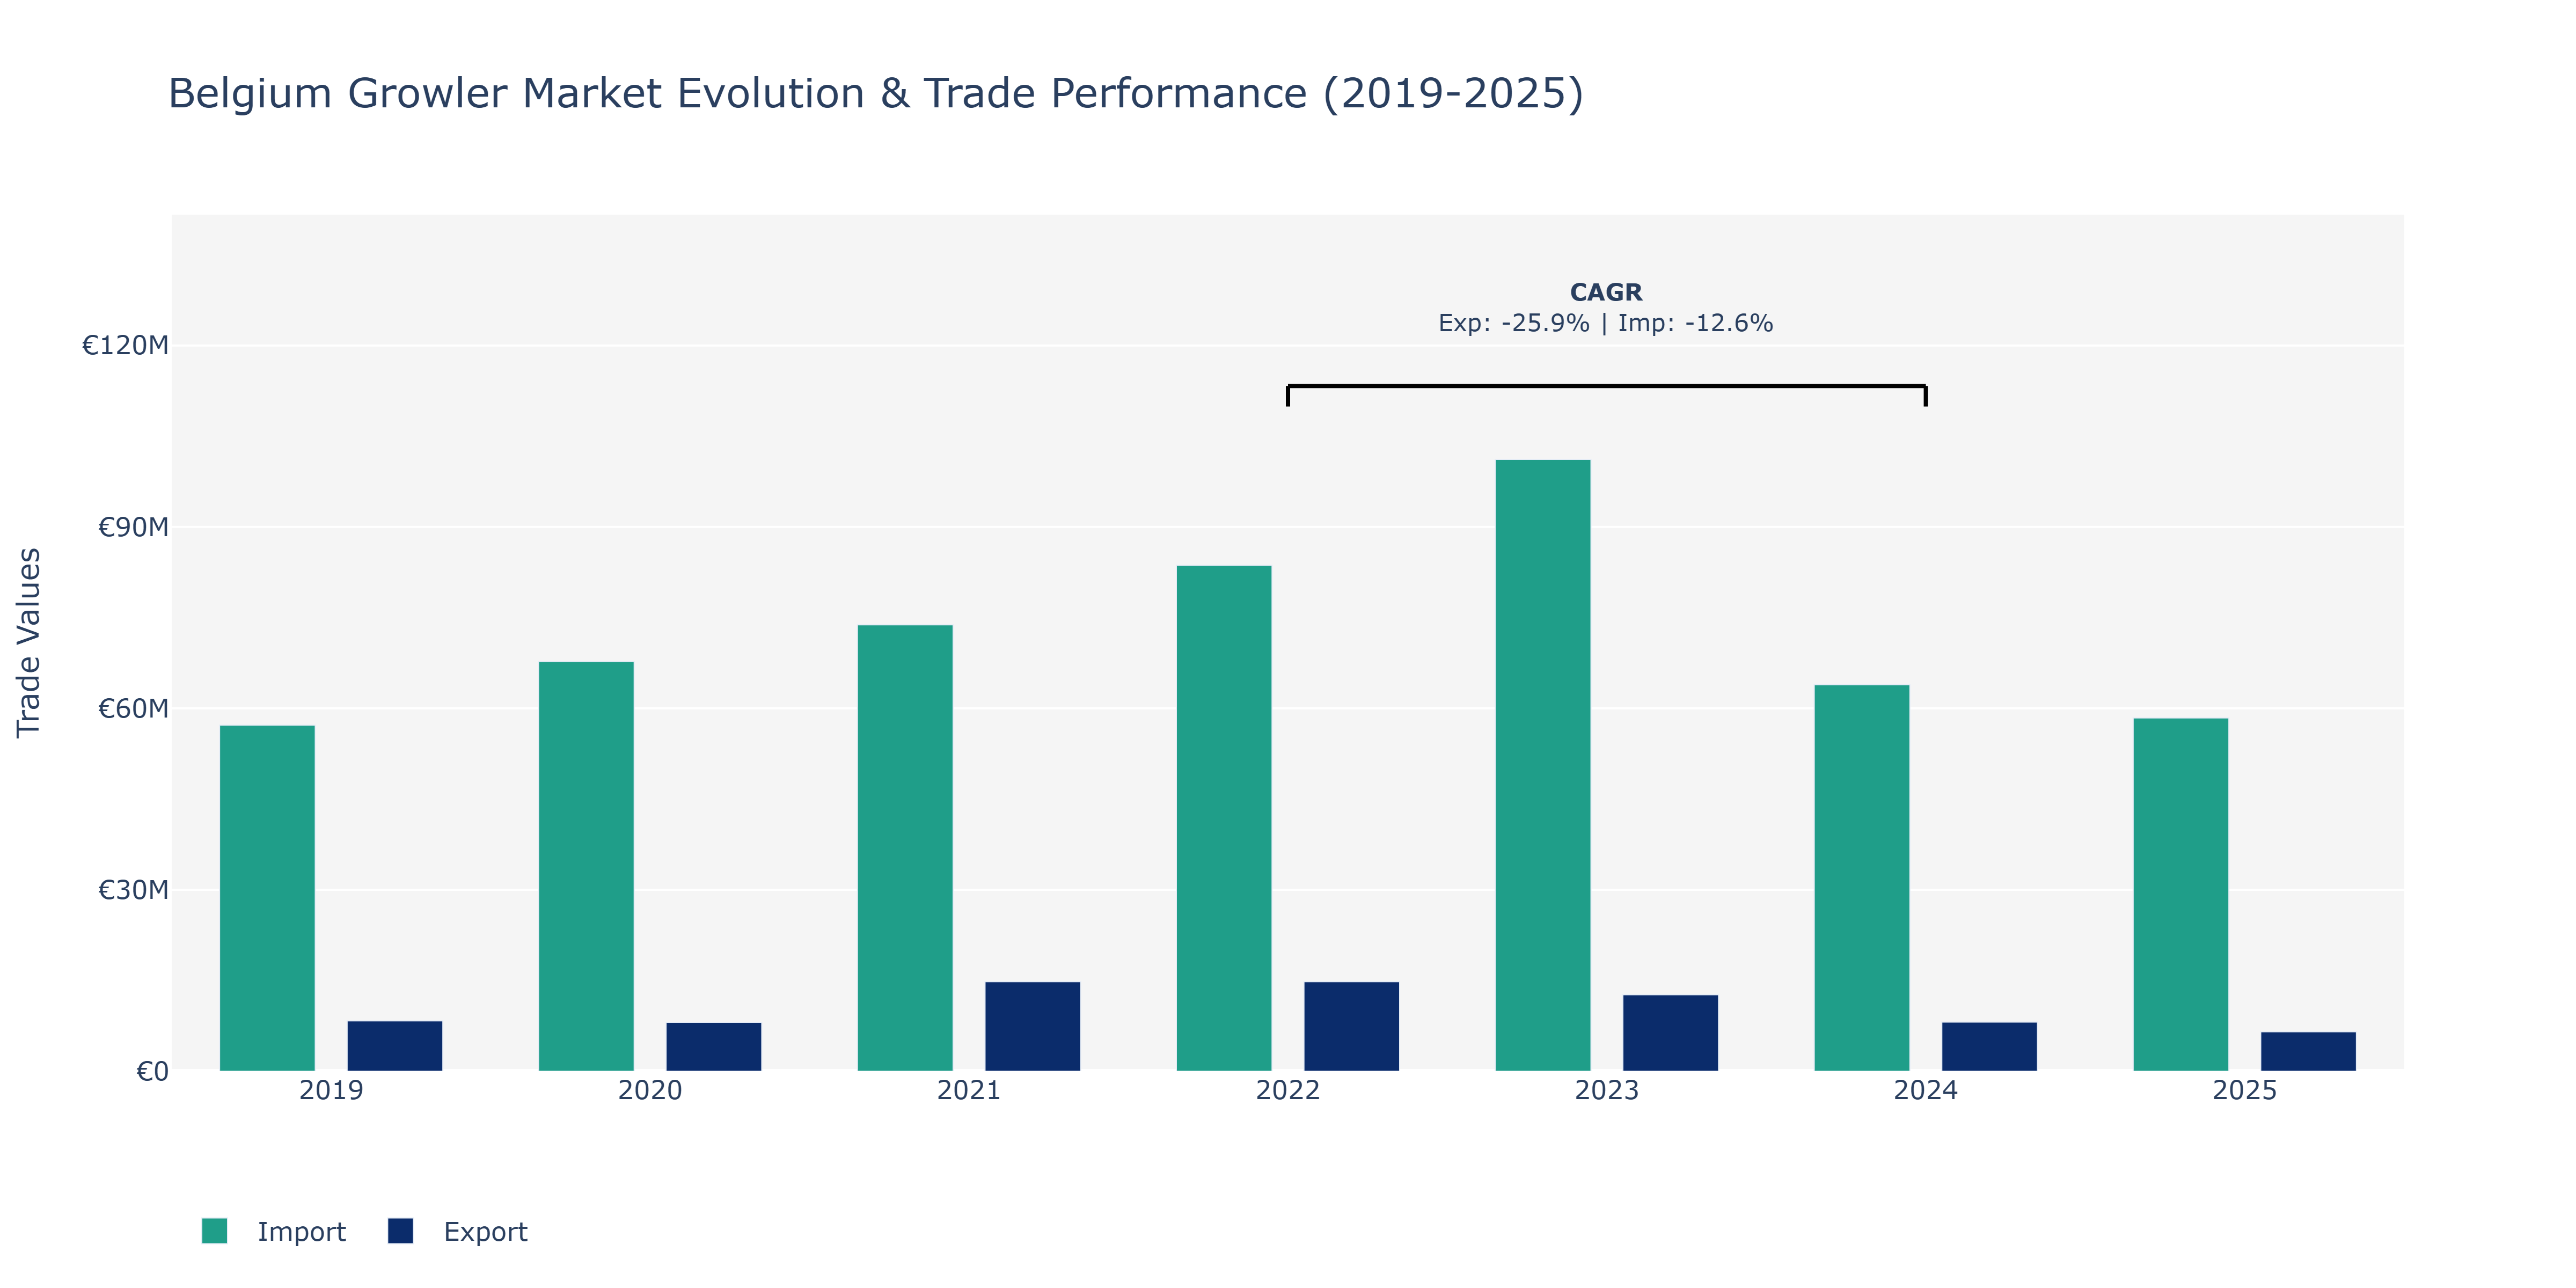
The Belgium Growler Market witnessed fluctuations in both Exports and Imports from 2019 to 2025. Exports started at €8.32 million in 2019, declined to €6.52 million in 2025, with a peak of €14.79 million in 2021. In contrast, Imports increased from €57.21 million in 2019 to €101.16 million in 2023, then decreased to €58.41 million in 2025. The substantial drop in Exports post-2021 could be attributed to changing consumer preferences, market saturation, or global economic conditions affecting demand. Conversely, the surge in Imports until 2023 might reflect increased domestic consumption, a shift in production patterns, or heightened international trade agreements benefitting imports. These movements suggest a dynamic market landscape in Belgium for Growlers, influenced by various economic and industry-specific factors. Additional analysis incorporating consumer behavior studies and trade policies could provide further insights into these shifts.
Key Highlights of the Report:
- Belgium Growler Market Outlook
- Market Size of Belgium Growler Market, 2025
- Forecast of Belgium Growler Market, 2032
- Historical Data and Forecast of Belgium Growler Revenues & Volume for the Period 2022 - 2032
- Belgium Growler Market Trend Evolution
- Belgium Growler Market Drivers and Challenges
- Belgium Growler Price Trends
- Belgium Growler Porter's Five Forces
- Belgium Growler Industry Life Cycle
- Historical Data and Forecast of Belgium Growler Market Revenues & Volume By Capacity Type for the Period 2022 - 2032
- Historical Data and Forecast of Belgium Growler Market Revenues & Volume By 32Oz for the Period 2022 - 2032
- Historical Data and Forecast of Belgium Growler Market Revenues & Volume By 64Oz for the Period 2022 - 2032
- Historical Data and Forecast of Belgium Growler Market Revenues & Volume By 128Oz for the Period 2022 - 2032
- Historical Data and Forecast of Belgium Growler Market Revenues & Volume By Application for the Period 2022 - 2032
- Historical Data and Forecast of Belgium Growler Market Revenues & Volume By Alcoholic Beverages for the Period 2022 - 2032
- Historical Data and Forecast of Belgium Growler Market Revenues & Volume By Beer for the Period 2022 - 2032
- Historical Data and Forecast of Belgium Growler Market Revenues & Volume By Wines for the Period 2022 - 2032
- Historical Data and Forecast of Belgium Growler Market Revenues & Volume By Others for the Period 2022 - 2032
- Historical Data and Forecast of Belgium Growler Market Revenues & Volume By Non-Alcoholic Beverages for the Period 2022 - 2032
- Historical Data and Forecast of Belgium Growler Market Revenues & Volume By Material for the Period 2022 - 2032
- Historical Data and Forecast of Belgium Growler Market Revenues & Volume By Glass for the Period 2022 - 2032
- Historical Data and Forecast of Belgium Growler Market Revenues & Volume By Plastic for the Period 2022 - 2032
- Historical Data and Forecast of Belgium Growler Market Revenues & Volume By Metal for the Period 2022 - 2032
- Historical Data and Forecast of Belgium Growler Market Revenues & Volume By Ceramic for the Period 2022 - 2032
- Historical Data and Forecast of Belgium Growler Market Revenues & Volume By Sales Channel for the Period 2022 - 2032
- Historical Data and Forecast of Belgium Growler Market Revenues & Volume By Online for the Period 2022 - 2032
- Historical Data and Forecast of Belgium Growler Market Revenues & Volume By Offline for the Period 2022 - 2032
- Historical Data and Forecast of Belgium Growler Market Revenues & Volume By Breweries for the Period 2022 - 2032
- Historical Data and Forecast of Belgium Growler Market Revenues & Volume By Hypermarket for the Period 2022 - 2032
- Historical Data and Forecast of Belgium Growler Market Revenues & Volume By Convenience Stores for the Period 2022 - 2032
- Historical Data and Forecast of Belgium Growler Market Revenues & Volume By End User for the Period 2022 - 2032
- Historical Data and Forecast of Belgium Growler Market Revenues & Volume By Commercial for the Period 2022 - 2032
- Historical Data and Forecast of Belgium Growler Market Revenues & Volume By Residential for the Period 2022 - 2032
- Belgium Growler Import Export Trade Statistics
- Market Opportunity Assessment By Capacity Type
- Market Opportunity Assessment By Application
- Market Opportunity Assessment By Material
- Market Opportunity Assessment By Sales Channel
- Market Opportunity Assessment By End User
- Belgium Growler Top Companies Market Share
- Belgium Growler Competitive Benchmarking By Technical and Operational Parameters
- Belgium Growler Company Profiles
- Belgium Growler Key Strategic Recommendations
Frequently Asked Questions About the Market Study (FAQs):
6Wresearch actively monitors the Belgium Growler Market and publishes its comprehensive annual report, highlighting emerging trends, growth drivers, revenue analysis, and forecast outlook. Our insights help businesses to make data-backed strategic decisions with ongoing market dynamics. Our analysts track relevent industries related to the Belgium Growler Market, allowing our clients with actionable intelligence and reliable forecasts tailored to emerging regional needs.
Yes, we provide customisation as per your requirements. To learn more, feel free to contact us on sales@6wresearch.com
1 Executive Summary |
2 Introduction |
2.1 Key Highlights of the Report |
2.2 Report Description |
2.3 Market Scope & Segmentation |
2.4 Research Methodology |
2.5 Assumptions |
3 Belgium Growler Market Overview |
3.1 Belgium Country Macro Economic Indicators |
3.2 Belgium Growler Market Revenues & Volume, 2022 & 2032F |
3.3 Belgium Growler Market - Industry Life Cycle |
3.4 Belgium Growler Market - Porter's Five Forces |
3.5 Belgium Growler Market Revenues & Volume Share, By Capacity Type, 2022 & 2032F |
3.6 Belgium Growler Market Revenues & Volume Share, By Application, 2022 & 2032F |
3.7 Belgium Growler Market Revenues & Volume Share, By Material, 2022 & 2032F |
3.8 Belgium Growler Market Revenues & Volume Share, By Sales Channel, 2022 & 2032F |
3.9 Belgium Growler Market Revenues & Volume Share, By End User, 2022 & 2032F |
4 Belgium Growler Market Dynamics |
4.1 Impact Analysis |
4.2 Market Drivers |
4.3 Market Restraints |
5 Belgium Growler Market Trends |
6 Belgium Growler Market, By Types |
6.1 Belgium Growler Market, By Capacity Type |
6.1.1 Overview and Analysis |
6.1.2 Belgium Growler Market Revenues & Volume, By Capacity Type, 2022 - 2032F |
6.1.3 Belgium Growler Market Revenues & Volume, By 32Oz, 2022 - 2032F |
6.1.4 Belgium Growler Market Revenues & Volume, By 64Oz, 2022 - 2032F |
6.1.5 Belgium Growler Market Revenues & Volume, By 128Oz, 2022 - 2032F |
6.2 Belgium Growler Market, By Application |
6.2.1 Overview and Analysis |
6.2.2 Belgium Growler Market Revenues & Volume, By Alcoholic Beverages, 2022 - 2032F |
6.2.3 Belgium Growler Market Revenues & Volume, By Beer, 2022 - 2032F |
6.2.4 Belgium Growler Market Revenues & Volume, By Wines, 2022 - 2032F |
6.2.5 Belgium Growler Market Revenues & Volume, By Others, 2022 - 2032F |
6.2.6 Belgium Growler Market Revenues & Volume, By Non-Alcoholic Beverages, 2022 - 2032F |
6.3 Belgium Growler Market, By Material |
6.3.1 Overview and Analysis |
6.3.2 Belgium Growler Market Revenues & Volume, By Glass, 2022 - 2032F |
6.3.3 Belgium Growler Market Revenues & Volume, By Plastic, 2022 - 2032F |
6.3.4 Belgium Growler Market Revenues & Volume, By Metal, 2022 - 2032F |
6.3.5 Belgium Growler Market Revenues & Volume, By Ceramic, 2022 - 2032F |
6.4 Belgium Growler Market, By Sales Channel |
6.4.1 Overview and Analysis |
6.4.2 Belgium Growler Market Revenues & Volume, By Online, 2022 - 2032F |
6.4.3 Belgium Growler Market Revenues & Volume, By Offline, 2022 - 2032F |
6.4.4 Belgium Growler Market Revenues & Volume, By Breweries, 2022 - 2032F |
6.4.5 Belgium Growler Market Revenues & Volume, By Hypermarket, 2022 - 2032F |
6.4.6 Belgium Growler Market Revenues & Volume, By Convenience Stores, 2022 - 2032F |
6.5 Belgium Growler Market, By End User |
6.5.1 Overview and Analysis |
6.5.2 Belgium Growler Market Revenues & Volume, By Commercial, 2022 - 2032F |
6.5.3 Belgium Growler Market Revenues & Volume, By Residential, 2022 - 2032F |
7 Belgium Growler Market Import-Export Trade Statistics |
7.1 Belgium Growler Market Export to Major Countries |
7.2 Belgium Growler Market Imports from Major Countries |
8 Belgium Growler Market Key Performance Indicators |
9 Belgium Growler Market - Opportunity Assessment |
9.1 Belgium Growler Market Opportunity Assessment, By Capacity Type, 2022 & 2032F |
9.2 Belgium Growler Market Opportunity Assessment, By Application, 2022 & 2032F |
9.3 Belgium Growler Market Opportunity Assessment, By Material, 2022 & 2032F |
9.4 Belgium Growler Market Opportunity Assessment, By Sales Channel, 2022 & 2032F |
9.5 Belgium Growler Market Opportunity Assessment, By End User, 2022 & 2032F |
10 Belgium Growler Market - Competitive Landscape |
10.1 Belgium Growler Market Revenue Share, By Companies, 2025 |
10.2 Belgium Growler Market Competitive Benchmarking, By Operating and Technical Parameters |
11 Company Profiles |
12 Recommendations |
13 Disclaimer |
Global Go To Market Strategy - 2030
Export potential enables firms to identify high-growth global markets with greater confidence by combining advanced trade intelligence with a structured quantitative methodology. The framework analyzes emerging demand trends and country-level import patterns while integrating macroeconomic and trade datasets such as GDP and population forecasts, bilateral import–export flows, tariff structures, elasticity differentials between developed and developing economies, geographic distance, and import demand projections. Using weighted trade values from 2020–2024 as the base period to project country-to-country export potential for 2030, these inputs are operationalized through calculated drivers such as gravity model parameters, tariff impact factors, and projected GDP per-capita growth. Through an analysis of hidden potentials, demand hotspots, and market conditions that are most favorable to success, this method enables firms to focus on target countries, maximize returns, and global expansion with data, backed by accuracy.
By factoring in the projected importer demand gap that is currently unmet and could be potential opportunity, it identifies the potential for the Exporter (Country) among 190 countries, against the general trade analysis, which identifies the biggest importer or exporter.
To discover high-growth global markets and optimize your business strategy:
Click Here
Pricing
- Single User License$ 1,995
- Department License$ 2,400
- Site License$ 3,120
- Global License$ 3,795

Leadership Perspectives from Industry Events
Search
Thought Leadership and Analyst Meet


Our Clients
6WResearch In News
- India Export Attractiveness Tracker 2026
- India Air Conditioner Market Set for Strong Rebound in 2026 After Weather-Led Correction and GST-Driven Recovery: 6Wresearch
- ADAS in India: How Automatic Emergency Braking, Blind Spot Detection & Driver Monitoring are Transforming Road Safety
- Doha a strategic location for EV manufacturing hub: IPA Qatar
- Demand for luxury TVs surging in the GCC, says Samsung
- Empowering Growth: The Thriving Journey of Bangladesh’s Cable Industry
Latest Reports
- Qatar Access and Home Network Market (2026-2032)
- Nicaragua RPG Gaming Market (2026-2032)
- New Zealand RPG Gaming Market (2026-2032)
- Netherlands RPG Gaming Market (2026-2032)
- Nauru RPG Gaming Market (2026-2032)
- Namibia RPG Gaming Market (2026-2032)
- Mozambique RPG Gaming Market (2026-2032)
- Montenegro RPG Gaming Market (2026-2032)
- Mongolia RPG Gaming Market (2026-2032)
- Monaco RPG Gaming Market (2026-2032)
Industry Events and Analyst Meet

EV India Expo 2026

HIMTEX 2026

India Refining Summit 2026

India EV Show 2026

EV tech India Expo 2026
Whitepaper
- Middle East & Africa Commercial Security Market Click here to view more.
- Middle East & Africa Fire Safety Systems & Equipment Market Click here to view more.
- GCC Drone Market Click here to view more.
- Middle East Lighting Fixture Market Click here to view more.
- GCC Physical & Perimeter Security Market Click here to view more.