Croatia Urea Market (2025-2031) | Industry, Segmentation, Outlook, Share, Companies, Revenue, Value, Growth, Trends, Forecast, Size & Analysis
Market Forecast By Grade (Fertilizer, Feed, Technical), By End-user Industry (Agriculture, Chemical, Automotive, Medical, Others) And Competitive Landscape
| Product Code: ETC4901072 | Publication Date: Nov 2023 | Updated Date: Apr 2026 | Product Type: Market Research Report | |
| Publisher: 6Wresearch | Author: Sachin Kumar Rai | No. of Pages: 60 | No. of Figures: 30 | No. of Tables: 5 |
Croatia Urea Market Size (2020-2030)
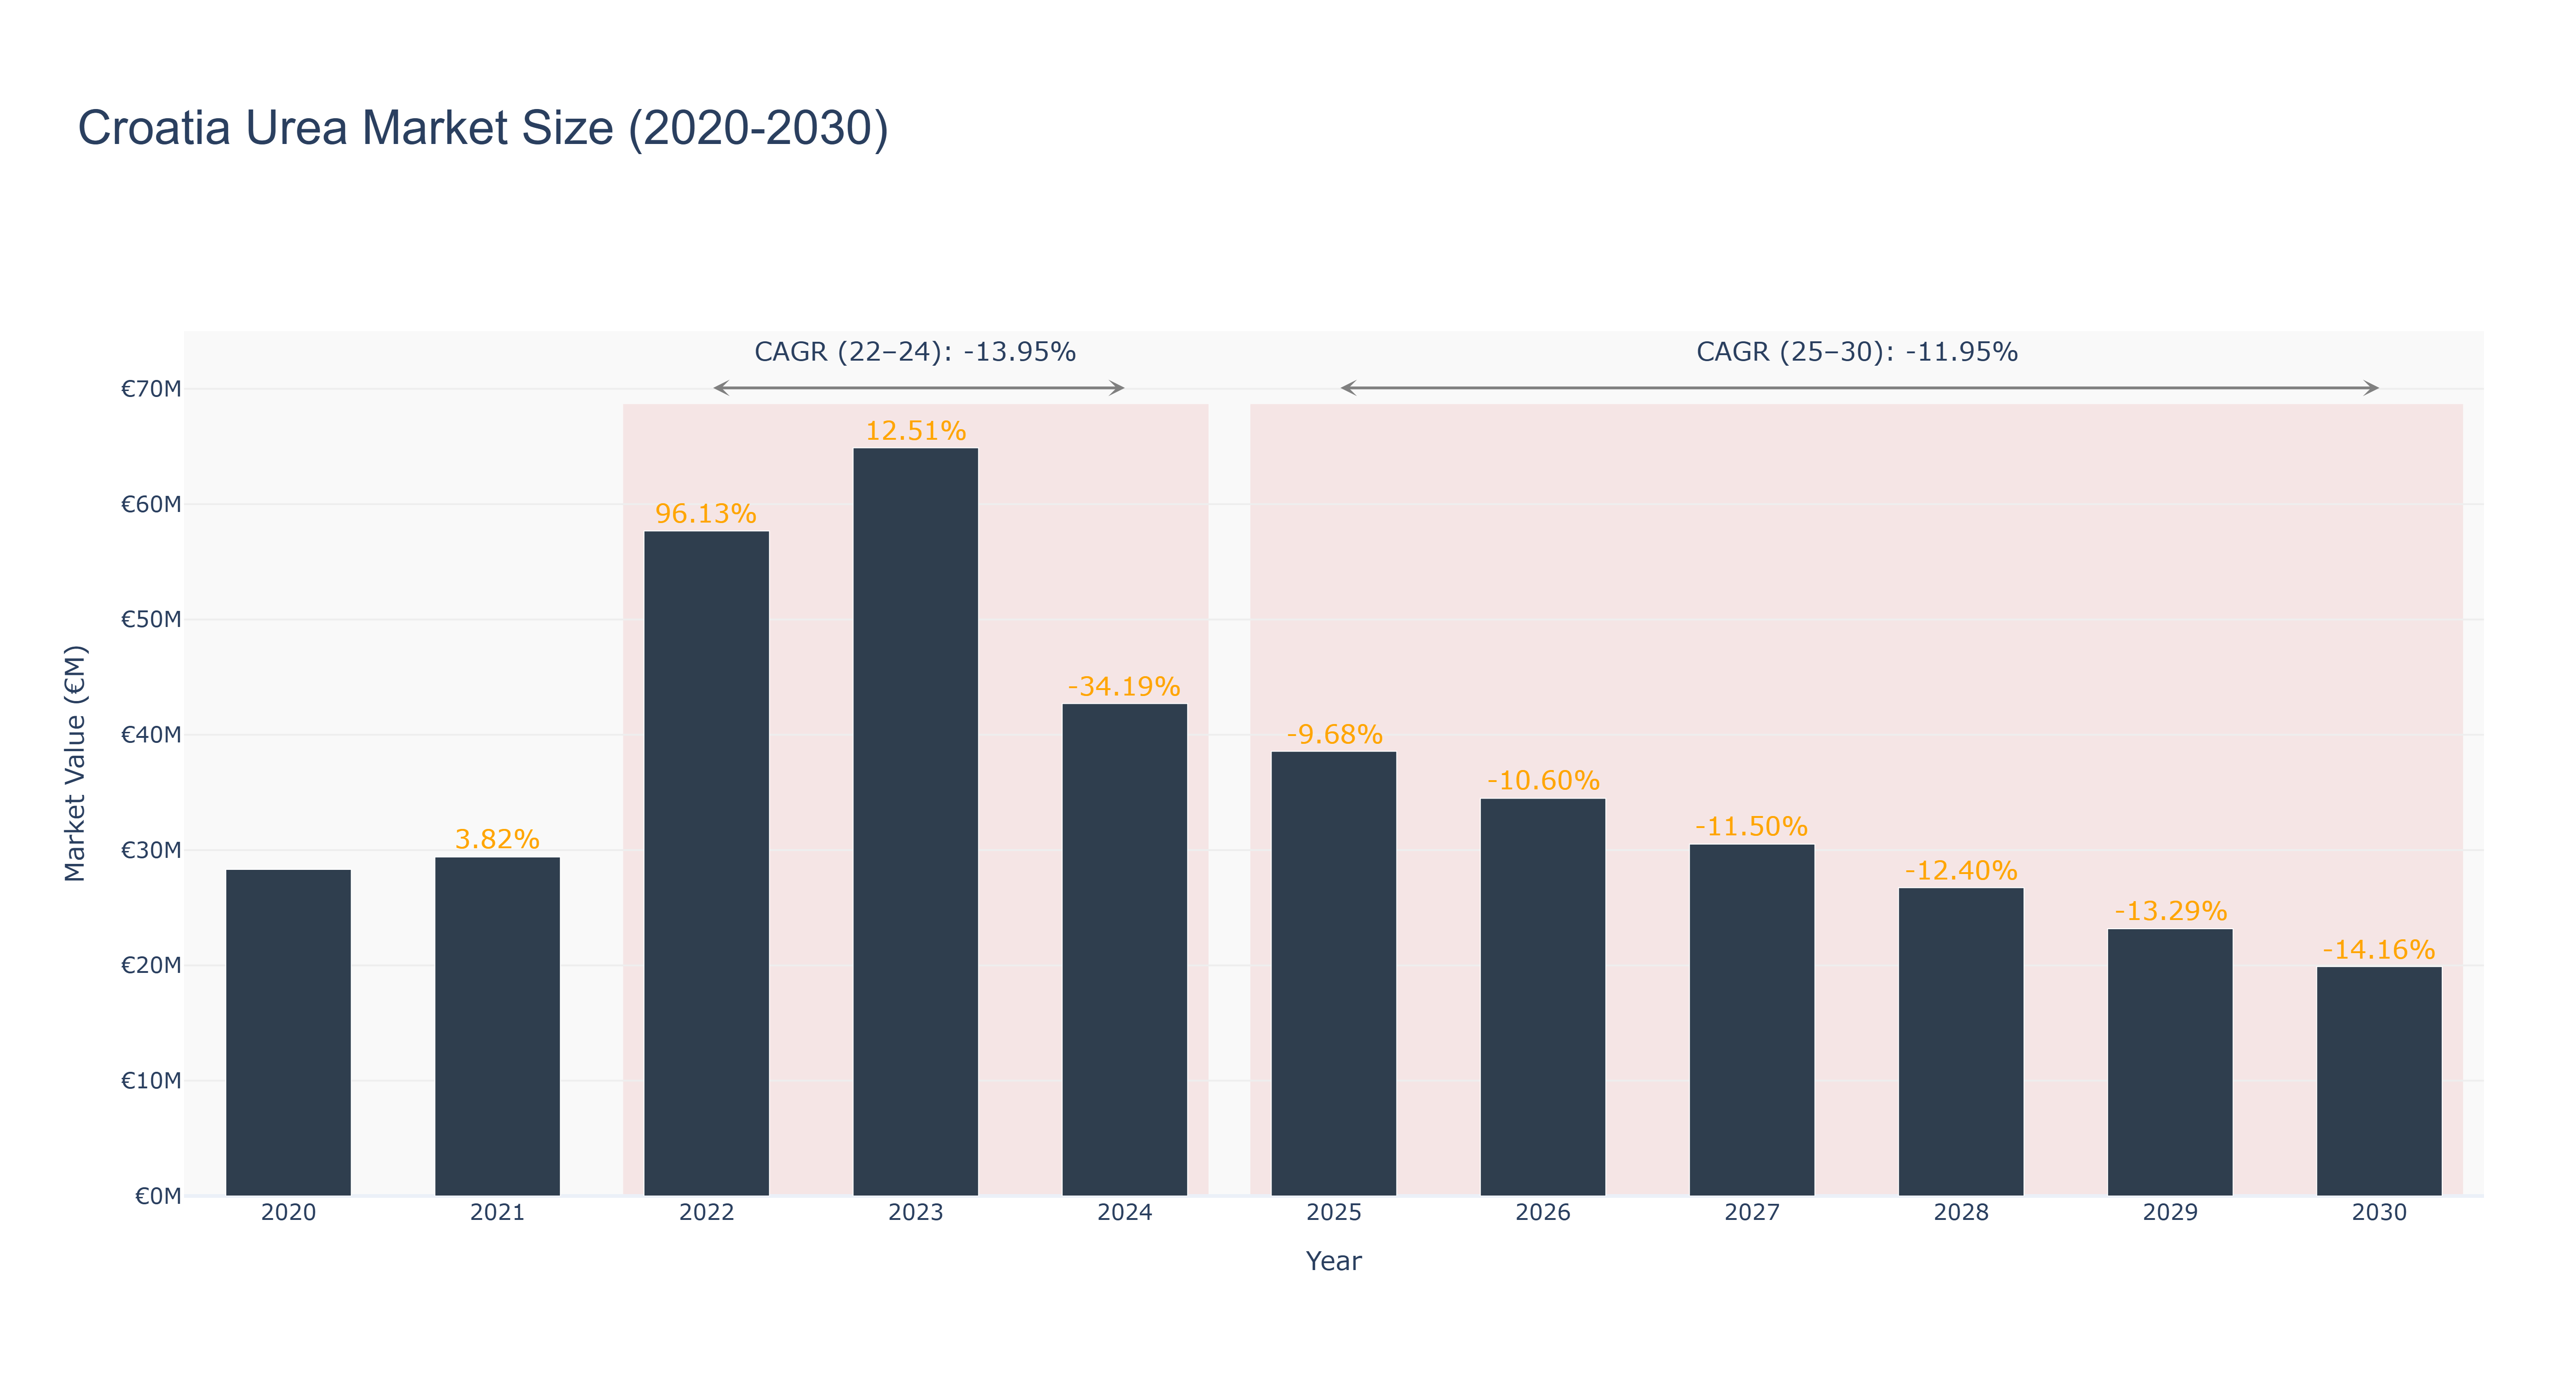
Croatia Urea Market has experienced fluctuations in market size over the years. The peak market size was €64.89 million in 2023, followed by a decline to €42.71 million in 2024. Forecasted market sizes show a further decrease to €19.90 million by 2030. The CAGR for the period 2022-24 was -13.95%, while for 2025-30, it is estimated at -11.95%. The market saw a significant drop in size due to various factors such as changing agricultural practices, global economic conditions, and environmental regulations impacting the fertilizer industry. Looking ahead, Croatia is focusing on sustainable agriculture initiatives and investing in innovative technologies to boost the urea market. Future developments may include collaborations with research institutions to enhance product efficiency and reduce environmental impact.
Croatia Urea Market: Production & Trade Performance (2019-2025)
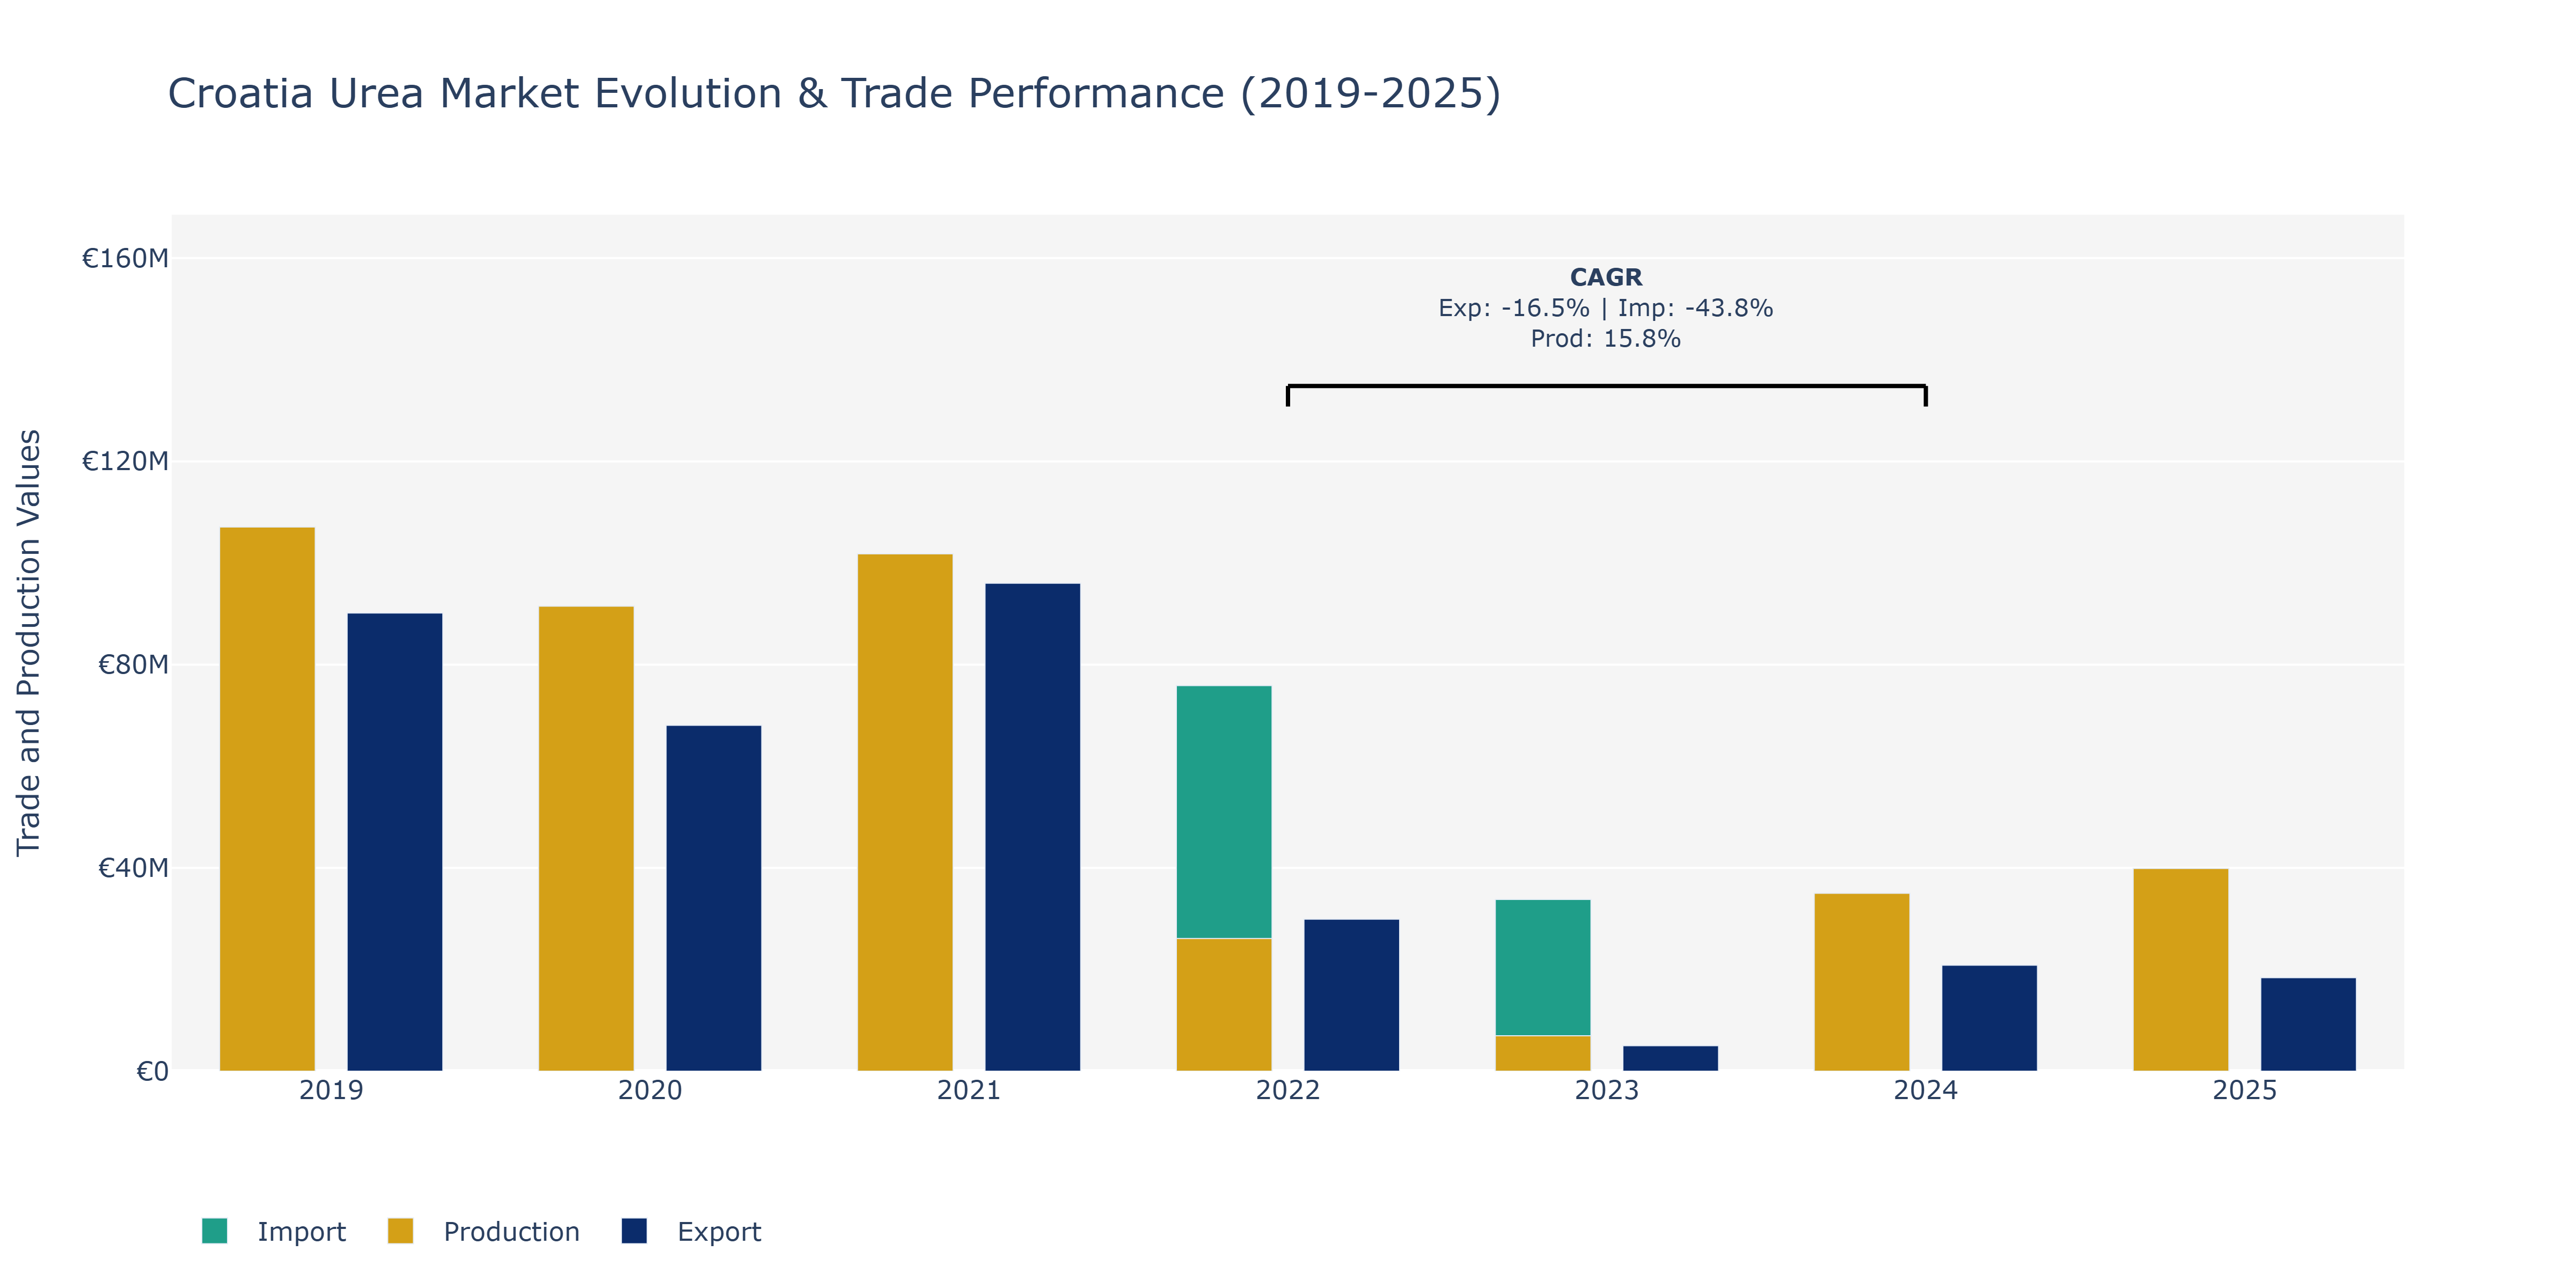
In the Croatia Urea Market, from 2019 to 2025, there are notable fluctuations in Exports, Imports, and Production. Exports were at their peak in 2019 at €90.16 million, then experienced a sharp decline in 2020 to €68.05 million before a slight recovery in 2021 to €96.01 million. However, a substantial drop was observed in 2022 to €29.91 million, with a slight recovery in 2023 and 2024. Imports peaked in 2021 at €18.59 million, significantly increasing from the previous year, but then dropped sharply in 2022 to €75.87 million. Production saw a peak in 2021 at €101.79 million, showcasing a steady increase from 2019 with a notable CAGR of 15.76%. The fluctuations in exports and imports could be influenced by global demand shifts, trade agreements, and currency fluctuations. The rise in production may be attributed to technological advancements, increased efficiency, and growing domestic demand for urea products in Croatia.
Croatia Urea Market Overview
The urea market in Croatia involves the production and application of urea, a key nitrogenous fertilizer used in agriculture. The market is influenced by agricultural demand, advancements in fertilizer technology, and environmental regulations. The market is supported by the need for efficient and high-yield fertilizers to enhance crop production.
Drivers of the market
The urea market in Croatia is expanding as urea is widely used in fertilizers, chemicals, and industrial processes. Urea provides essential nutrients for agriculture and is a key raw material in various chemical processes. The market is driven by advancements in urea production technologies, the rise in agricultural activities, and the growth of the chemical industry. The focus on developing efficient urea production processes and enhancing its applications supports market growth.
Challenges of the market
The urea market in Croatia is affected by fluctuations in global urea prices and the high costs of production. The market also faces challenges related to environmental regulations and the need to adopt more sustainable production methods. Competition from alternative fertilizers and changes in agricultural practices further impact market dynamics.
Government Policy of the market
The Croatian government supports the agricultural sector by promoting the use of efficient and environmentally friendly fertilizers, including urea. Policies encourage sustainable farming practices, with financial incentives available for farmers and companies investing in advanced urea production and application technologies.
Key Highlights of the Report:
- Croatia Urea Market Outlook
- Market Size of Croatia Urea Market, 2024
- Forecast of Croatia Urea Market, 2031
- Historical Data and Forecast of Croatia Urea Revenues & Volume for the Period 2021-2031
- Croatia Urea Market Trend Evolution
- Croatia Urea Market Drivers and Challenges
- Croatia Urea Price Trends
- Croatia Urea Porter`s Five Forces
- Croatia Urea Industry Life Cycle
- Historical Data and Forecast of Croatia Urea Market Revenues & Volume By Grade for the Period 2021-2031
- Historical Data and Forecast of Croatia Urea Market Revenues & Volume By Fertilizer for the Period 2021-2031
- Historical Data and Forecast of Croatia Urea Market Revenues & Volume By Feed for the Period 2021-2031
- Historical Data and Forecast of Croatia Urea Market Revenues & Volume By Technical for the Period 2021-2031
- Historical Data and Forecast of Croatia Urea Market Revenues & Volume By End-user Industry for the Period 2021-2031
- Historical Data and Forecast of Croatia Urea Market Revenues & Volume By Agriculture for the Period 2021-2031
- Historical Data and Forecast of Croatia Urea Market Revenues & Volume By Chemical for the Period 2021-2031
- Historical Data and Forecast of Croatia Urea Market Revenues & Volume By Automotive for the Period 2021-2031
- Historical Data and Forecast of Croatia Urea Market Revenues & Volume By Medical for the Period 2021-2031
- Historical Data and Forecast of Croatia Urea Market Revenues & Volume By Others for the Period 2021-2031
- Croatia Urea Import Export Trade Statistics
- Market Opportunity Assessment By Grade
- Market Opportunity Assessment By End-user Industry
- Croatia Urea Top Companies Market Share
- Croatia Urea Competitive Benchmarking By Technical and Operational Parameters
- Croatia Urea Company Profiles
- Croatia Urea Key Strategic Recommendations
Frequently Asked Questions About the Market Study (FAQs):
6Wresearch actively monitors the Croatia Urea Market and publishes its comprehensive annual report, highlighting emerging trends, growth drivers, revenue analysis, and forecast outlook. Our insights help businesses to make data-backed strategic decisions with ongoing market dynamics. Our analysts track relevent industries related to the Croatia Urea Market, allowing our clients with actionable intelligence and reliable forecasts tailored to emerging regional needs.
Yes, we provide customisation as per your requirements. To learn more, feel free to contact us on sales@6wresearch.com
1 Executive Summary |
2 Introduction |
2.1 Key Highlights of the Report |
2.2 Report Description |
2.3 Market Scope & Segmentation |
2.4 Research Methodology |
2.5 Assumptions |
3 Croatia Urea Market Overview |
3.1 Croatia Country Macro Economic Indicators |
3.2 Croatia Urea Market Revenues & Volume, 2021 & 2031F |
3.3 Croatia Urea Market - Industry Life Cycle |
3.4 Croatia Urea Market - Porter's Five Forces |
3.5 Croatia Urea Market Revenues & Volume Share, By Grade, 2021 & 2031F |
3.6 Croatia Urea Market Revenues & Volume Share, By End-user Industry, 2021 & 2031F |
4 Croatia Urea Market Dynamics |
4.1 Impact Analysis |
4.2 Market Drivers |
4.2.1 Increasing demand for agricultural products in Croatia |
4.2.2 Government initiatives to boost agricultural productivity |
4.2.3 Growing adoption of urea as a cost-effective nitrogen fertilizer |
4.3 Market Restraints |
4.3.1 Fluctuating prices of urea in the global market |
4.3.2 Environmental concerns related to urea usage in agriculture |
4.3.3 Competition from alternative nitrogen fertilizers |
5 Croatia Urea Market Trends |
6 Croatia Urea Market Segmentations |
6.1 Croatia Urea Market, By Grade |
6.1.1 Overview and Analysis |
6.1.2 Croatia Urea Market Revenues & Volume, By Fertilizer, 2021-2031F |
6.1.3 Croatia Urea Market Revenues & Volume, By Feed, 2021-2031F |
6.1.4 Croatia Urea Market Revenues & Volume, By Technical, 2021-2031F |
6.2 Croatia Urea Market, By End-user Industry |
6.2.1 Overview and Analysis |
6.2.2 Croatia Urea Market Revenues & Volume, By Agriculture, 2021-2031F |
6.2.3 Croatia Urea Market Revenues & Volume, By Chemical, 2021-2031F |
6.2.4 Croatia Urea Market Revenues & Volume, By Automotive, 2021-2031F |
6.2.5 Croatia Urea Market Revenues & Volume, By Medical, 2021-2031F |
6.2.6 Croatia Urea Market Revenues & Volume, By Others, 2021-2031F |
7 Croatia Urea Market Import-Export Trade Statistics |
7.1 Croatia Urea Market Export to Major Countries |
7.2 Croatia Urea Market Imports from Major Countries |
8 Croatia Urea Market Key Performance Indicators |
8.1 Average selling price of urea in Croatia |
8.2 Number of government subsidies or incentives for urea usage in agriculture |
8.3 Adoption rate of urea compared to other nitrogen fertilizers |
8.4 Production capacity utilization of urea manufacturing plants in Croatia |
9 Croatia Urea Market - Opportunity Assessment |
9.1 Croatia Urea Market Opportunity Assessment, By Grade, 2021 & 2031F |
9.2 Croatia Urea Market Opportunity Assessment, By End-user Industry, 2021 & 2031F |
10 Croatia Urea Market - Competitive Landscape |
10.1 Croatia Urea Market Revenue Share, By Companies, 2024 |
10.2 Croatia Urea Market Competitive Benchmarking, By Operating and Technical Parameters |
11 Company Profiles |
12 Recommendations | 13 Disclaimer |
Global Go To Market Strategy - 2030
Export potential enables firms to identify high-growth global markets with greater confidence by combining advanced trade intelligence with a structured quantitative methodology. The framework analyzes emerging demand trends and country-level import patterns while integrating macroeconomic and trade datasets such as GDP and population forecasts, bilateral import–export flows, tariff structures, elasticity differentials between developed and developing economies, geographic distance, and import demand projections. Using weighted trade values from 2020–2024 as the base period to project country-to-country export potential for 2030, these inputs are operationalized through calculated drivers such as gravity model parameters, tariff impact factors, and projected GDP per-capita growth. Through an analysis of hidden potentials, demand hotspots, and market conditions that are most favorable to success, this method enables firms to focus on target countries, maximize returns, and global expansion with data, backed by accuracy.
By factoring in the projected importer demand gap that is currently unmet and could be potential opportunity, it identifies the potential for the Exporter (Country) among 190 countries, against the general trade analysis, which identifies the biggest importer or exporter.
To discover high-growth global markets and optimize your business strategy:
Click Here
Pricing
- Single User License$ 1,995
- Department License$ 2,400
- Site License$ 3,120
- Global License$ 3,795

Leadership Perspectives from Industry Events
Search
Thought Leadership and Analyst Meet


Our Clients
6WResearch In News
- Doha a strategic location for EV manufacturing hub: IPA Qatar
- Demand for luxury TVs surging in the GCC, says Samsung
- Empowering Growth: The Thriving Journey of Bangladesh’s Cable Industry
- Demand for luxury TVs surging in the GCC, says Samsung
- Video call with a traditional healer? Once unthinkable, it’s now common in South Africa
- Intelligent Buildings To Smooth GCC’s Path To Net Zero
Latest Reports
- Cape Verde Portable Hand-Thrown Extinguisher Market (2026-2032)
- Canada Portable Hand-Thrown Extinguisher Market (2026-2032)
- Cameroon Portable Hand-Thrown Extinguisher Market (2026-2032)
- Burundi Portable Hand-Thrown Extinguisher Market (2026-2032)
- Burkina Faso Portable Hand-Thrown Extinguisher Market (2026-2032)
- Bulgaria Portable Hand-Thrown Extinguisher Market (2026-2032)
- Brunei Portable Hand-Thrown Extinguisher Market (2026-2032)
- Botswana Portable Hand-Thrown Extinguisher Market (2026-2032)
- Bosnia and Herzegovina Portable Hand-Thrown Extinguisher Market (2026-2032)
- Bolivia Portable Hand-Thrown Extinguisher Market (2026-2032)
Industry Events and Analyst Meet

HIMTEX 2026

India Refining Summit 2026

India EV Show 2026

EV tech India Expo 2026

Auto Tech Asia 2026
Whitepaper
- Middle East & Africa Commercial Security Market Click here to view more.
- Middle East & Africa Fire Safety Systems & Equipment Market Click here to view more.
- GCC Drone Market Click here to view more.
- Middle East Lighting Fixture Market Click here to view more.
- GCC Physical & Perimeter Security Market Click here to view more.