Denmark Camphor Market (2026-2032) | Consumer Insights, Pricing Analysis, Demand, Forecast, Competitive, Strategy, Investment Trends, Outlook, Revenue, Segments, Strategic Insights, Opportunities, Challenges, Share, Analysis, Drivers, Size, Segmentation, Value, Growth, Supply, Restraints, Industry, Competition, Companies, Trends
Market Forecast By Product Type (Tablets, Oil), By Application (Pharmaceuticals, Religious Rituals), By End User (Healthcare, Households), By Source (Natural (Plant-Based), Synthetic) And Competitive Landscape
| Product Code: ETC11475416 | Publication Date: Apr 2025 | Updated Date: Apr 2026 | Product Type: Market Research Report | |
| Publisher: 6Wresearch | Author: Bhawna Singh | No. of Pages: 65 | No. of Figures: 34 | No. of Tables: 19 |
Denmark Camphor Market Size (2020-2030)
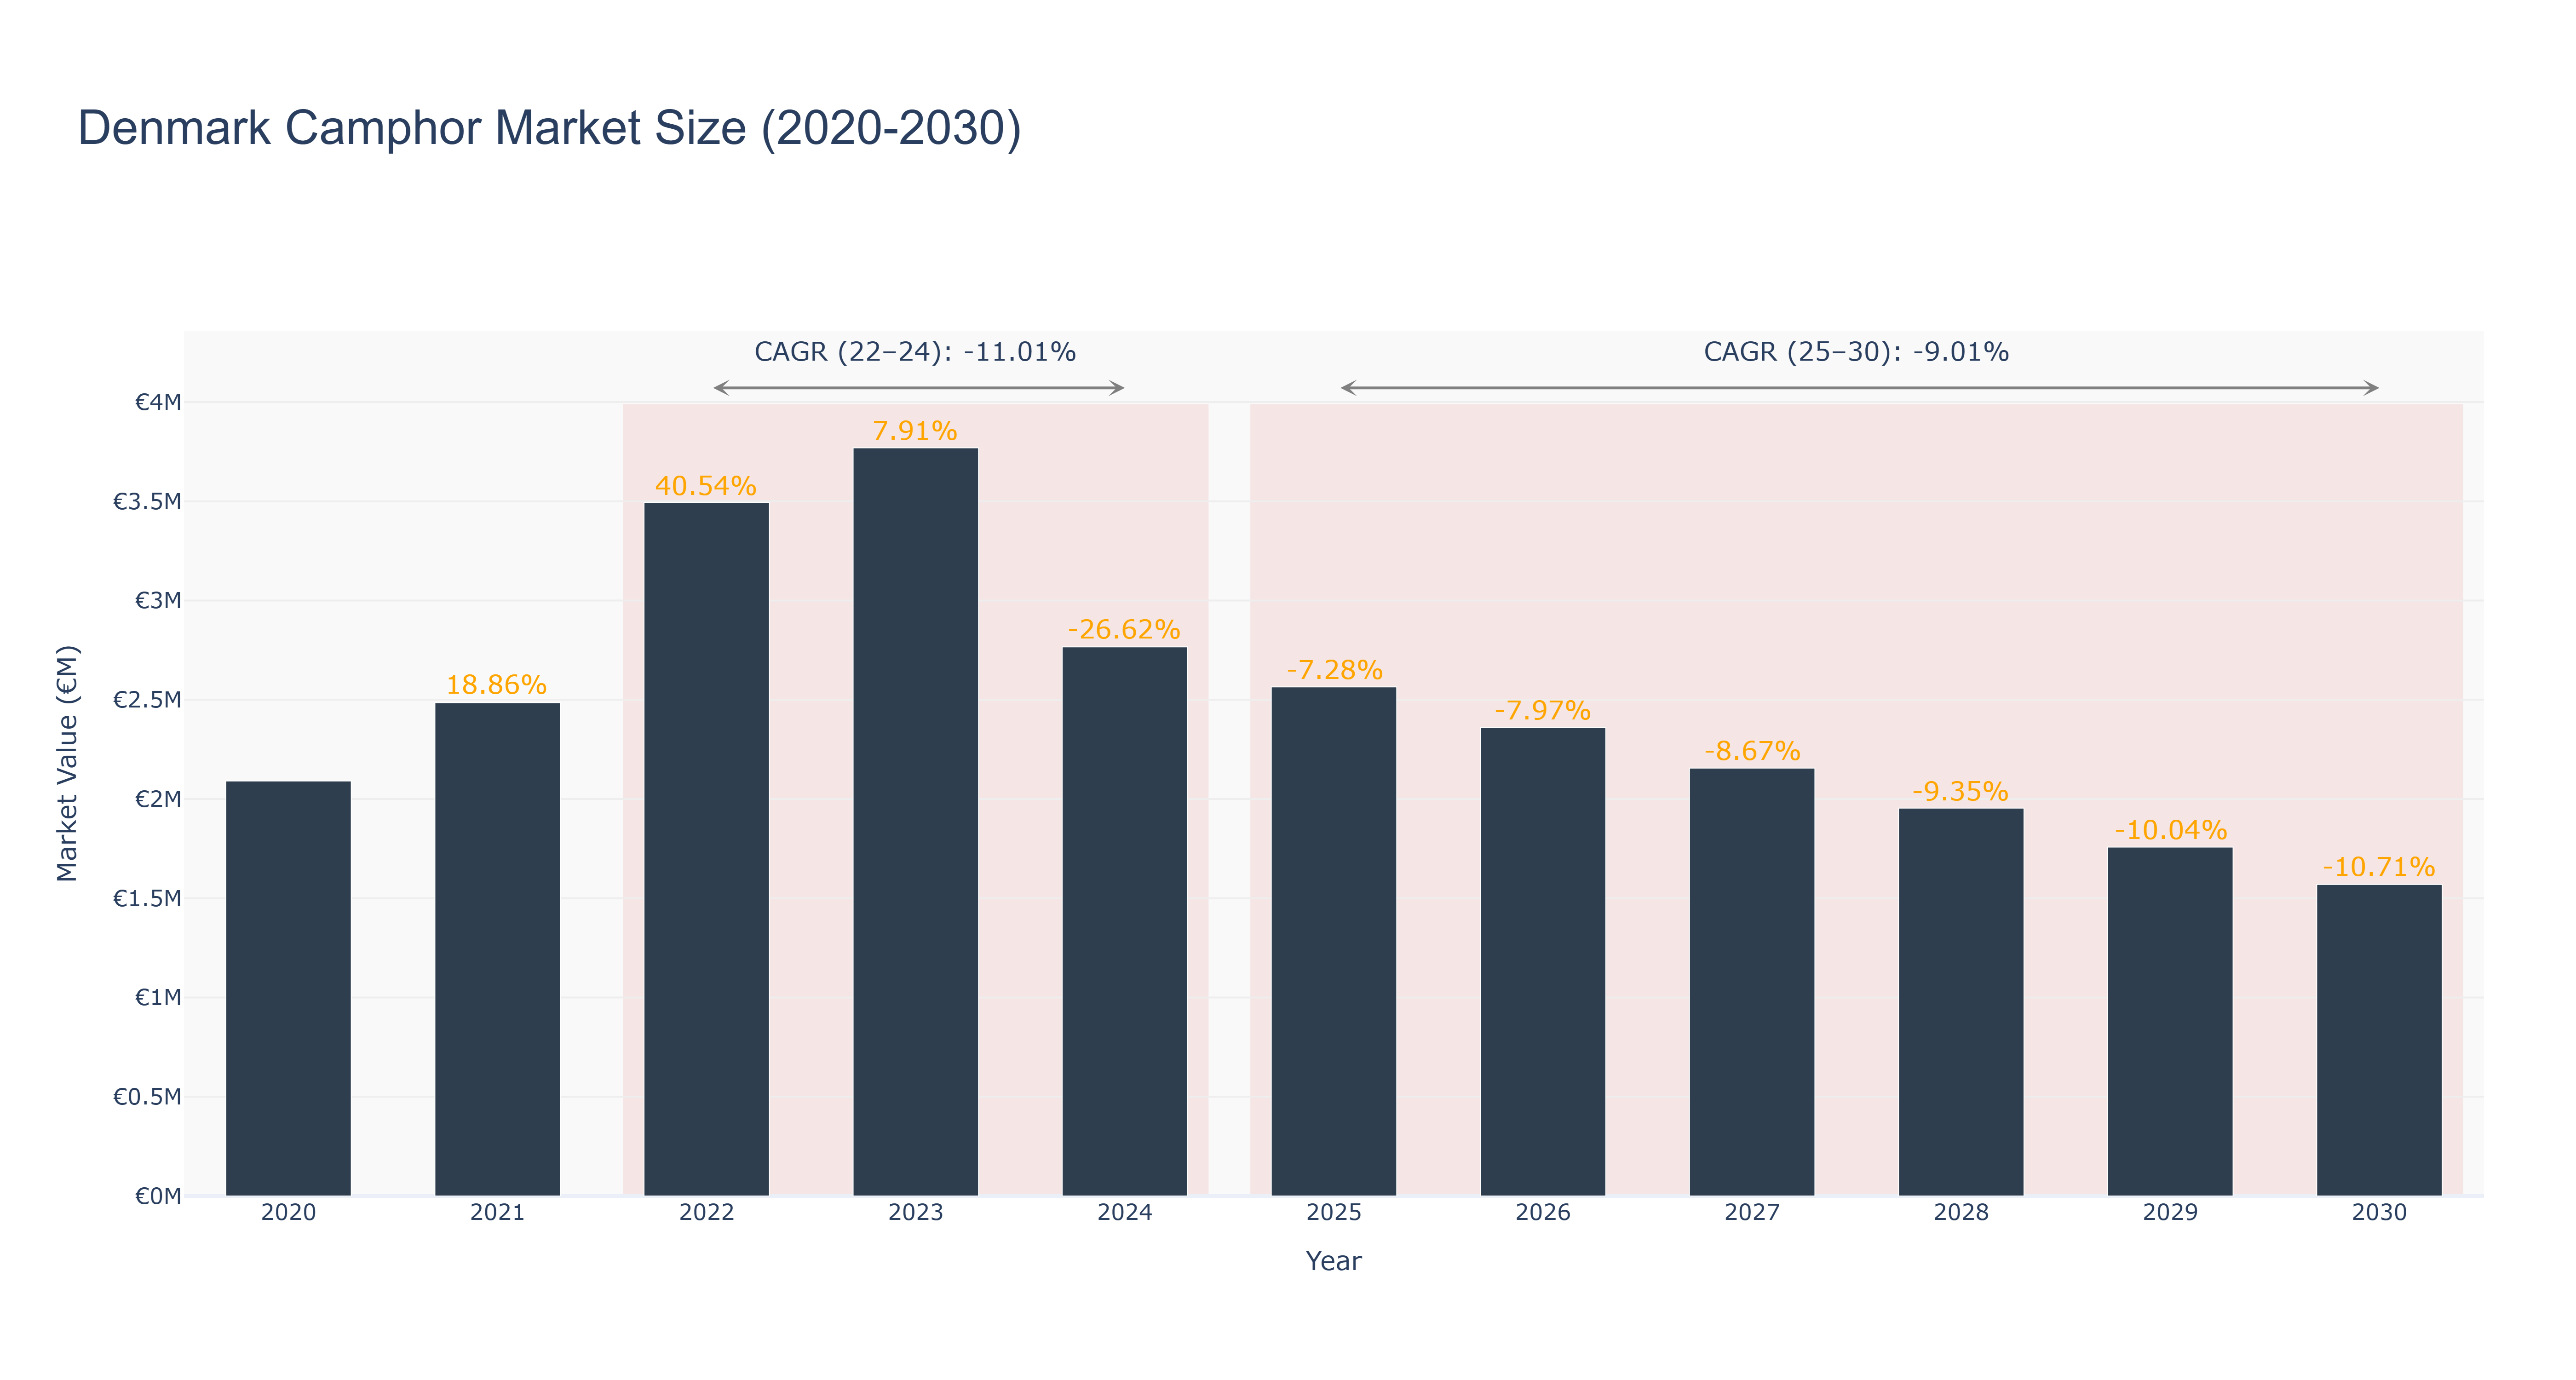
Denmark's Camphor Market has seen a fluctuating trend in market size over the years. The peak market size of €3.77 million was recorded in 2023, followed by a decline to €2.77 million in 2024. The market is forecasted to further decrease to €1.57 million by 2030, with a CAGR of -9.01% from 2025 to 2030. The recent downward trajectory can be attributed to factors like changing consumer preferences and economic conditions. However, industry drivers such as increasing awareness about natural products and potential applications in pharmaceuticals could potentially drive growth in the future. In the near future, Denmark's Camphor Market is expected to witness advancements in sustainable sourcing practices to meet the rising demand for eco-friendly products.
Denmark Camphor Market: Production & Trade Performance (2019-2025)
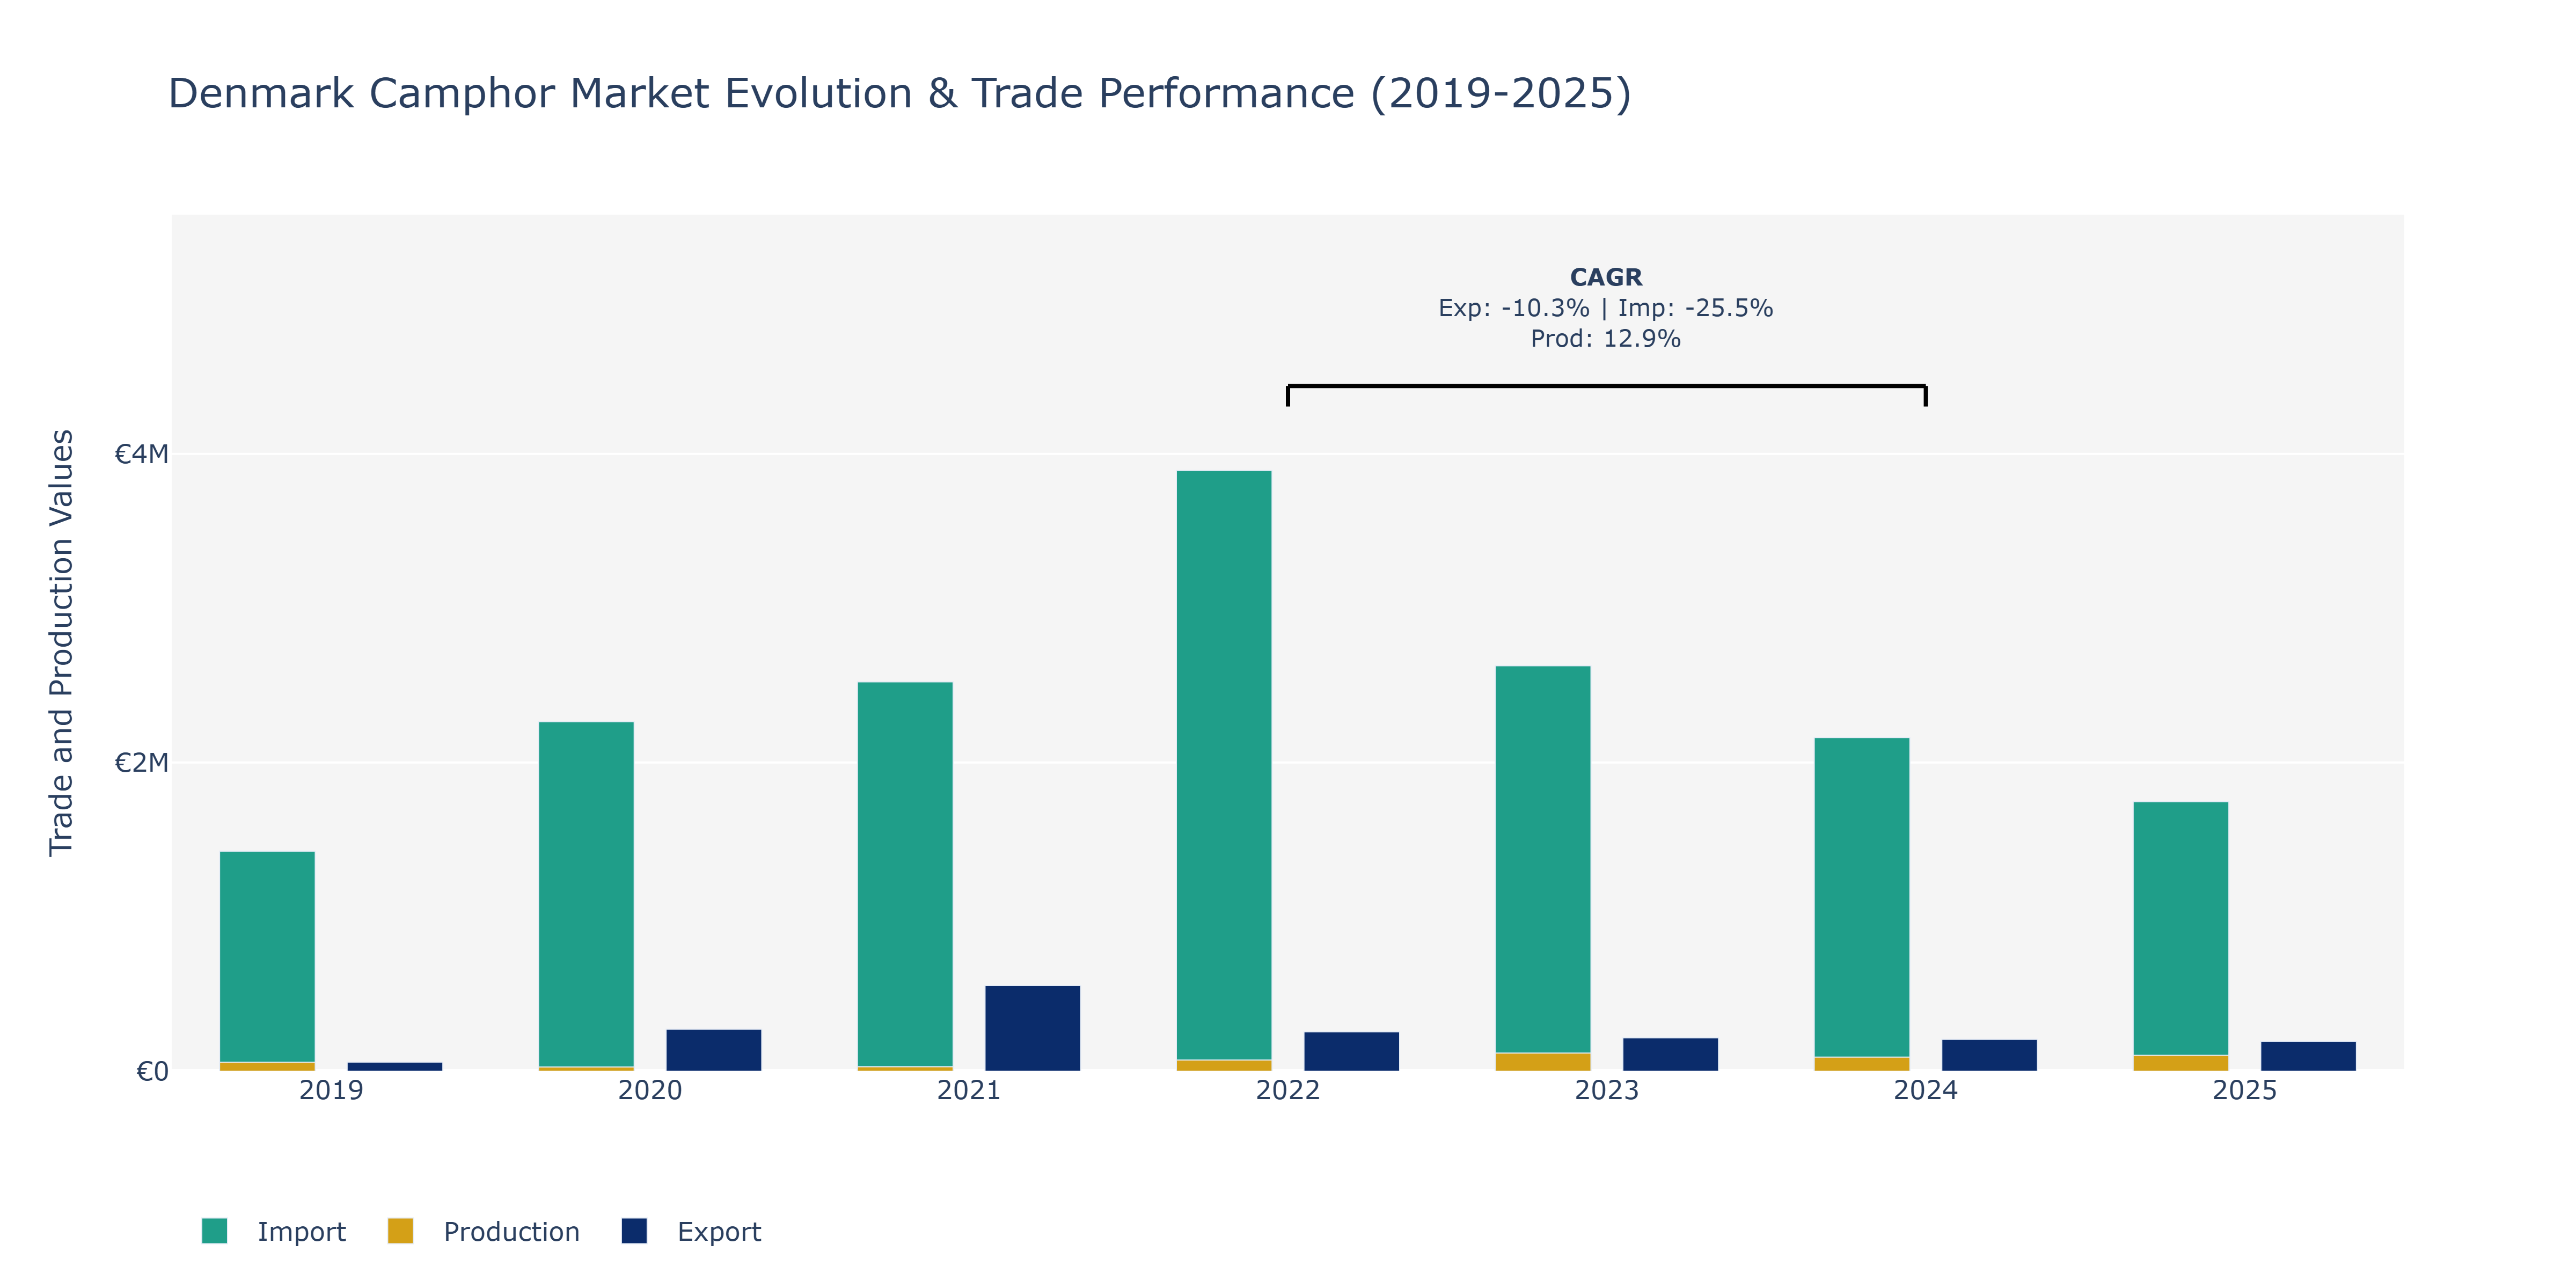
In the Denmark Camphor Market, from 2019 to 2025, there were notable fluctuations in exports, imports, and production. Exports saw a peak in 2021 at €556.51 thousand before experiencing a gradual decline to €192.29 thousand in 2025. Imports displayed a continuous downward trend, reaching €1.75 million in 2025, despite peaking at €3.89 million in 2022. Production showcased consistent growth, with a peak in 2023 at €117.30 thousand. The decline in exports can be attributed to fluctuating global demand for camphor-based products, while the decrease in imports might be influenced by shifts in sourcing strategies or domestic production capabilities. The upward trend in production aligns with increased domestic manufacturing capacity, potentially driven by advancements in technology or efficiency improvements in the production processes, as noted in industry reports on the pharmaceutical and fragrance sectors in Denmark.
Key Highlights of the Report:
- Denmark Camphor Market Outlook
- Market Size of Denmark Camphor Market, 2025
- Forecast of Denmark Camphor Market, 2032
- Historical Data and Forecast of Denmark Camphor Revenues & Volume for the Period 2022 - 2032F
- Denmark Camphor Market Trend Evolution
- Denmark Camphor Market Drivers and Challenges
- Denmark Camphor Price Trends
- Denmark Camphor Porter's Five Forces
- Denmark Camphor Industry Life Cycle
- Historical Data and Forecast of Denmark Camphor Market Revenues & Volume By Product Type for the Period 2022 - 2032F
- Historical Data and Forecast of Denmark Camphor Market Revenues & Volume By Tablets for the Period 2022 - 2032F
- Historical Data and Forecast of Denmark Camphor Market Revenues & Volume By Oil for the Period 2022 - 2032F
- Historical Data and Forecast of Denmark Camphor Market Revenues & Volume By Application for the Period 2022 - 2032F
- Historical Data and Forecast of Denmark Camphor Market Revenues & Volume By Pharmaceuticals for the Period 2022 - 2032F
- Historical Data and Forecast of Denmark Camphor Market Revenues & Volume By Religious Rituals for the Period 2022 - 2032F
- Historical Data and Forecast of Denmark Camphor Market Revenues & Volume By End User for the Period 2022 - 2032F
- Historical Data and Forecast of Denmark Camphor Market Revenues & Volume By Healthcare for the Period 2022 - 2032F
- Historical Data and Forecast of Denmark Camphor Market Revenues & Volume By Households for the Period 2022 - 2032F
- Historical Data and Forecast of Denmark Camphor Market Revenues & Volume By Source for the Period 2022 - 2032F
- Historical Data and Forecast of Denmark Camphor Market Revenues & Volume By Natural (Plant-Based) for the Period 2022 - 2032F
- Historical Data and Forecast of Denmark Camphor Market Revenues & Volume By Synthetic for the Period 2022 - 2032F
- Denmark Camphor Import Export Trade Statistics
- Market Opportunity Assessment By Product Type
- Market Opportunity Assessment By Application
- Market Opportunity Assessment By End User
- Market Opportunity Assessment By Source
- Denmark Camphor Top Companies Market Share
- Denmark Camphor Competitive Benchmarking By Technical and Operational Parameters
- Denmark Camphor Company Profiles
- Denmark Camphor Key Strategic Recommendations
Frequently Asked Questions About the Market Study (FAQs):
6Wresearch actively monitors the Denmark Camphor Market and publishes its comprehensive annual report, highlighting emerging trends, growth drivers, revenue analysis, and forecast outlook. Our insights help businesses to make data-backed strategic decisions with ongoing market dynamics. Our analysts track relevent industries related to the Denmark Camphor Market, allowing our clients with actionable intelligence and reliable forecasts tailored to emerging regional needs.
Yes, we provide customisation as per your requirements. To learn more, feel free to contact us on sales@6wresearch.com
1 Executive Summary |
2 Introduction |
2.1 Key Highlights of the Report |
2.2 Report Description |
2.3 Market Scope & Segmentation |
2.4 Research Methodology |
2.5 Assumptions |
3 Denmark Camphor Market Overview |
3.1 Denmark Country Macro Economic Indicators |
3.2 Denmark Camphor Market Revenues & Volume, 2022 & 2032F |
3.3 Denmark Camphor Market - Industry Life Cycle |
3.4 Denmark Camphor Market - Porter's Five Forces |
3.5 Denmark Camphor Market Revenues & Volume Share, By Product Type, 2022 & 2032F |
3.6 Denmark Camphor Market Revenues & Volume Share, By Application, 2022 & 2032F |
3.7 Denmark Camphor Market Revenues & Volume Share, By End User, 2022 & 2032F |
3.8 Denmark Camphor Market Revenues & Volume Share, By Source, 2022 & 2032F |
4 Denmark Camphor Market Dynamics |
4.1 Impact Analysis |
4.2 Market Drivers |
4.2.1 Growing awareness about the benefits of camphor in traditional medicine and skincare products |
4.2.2 Increasing demand for natural and organic products in Denmark |
4.2.3 Rising prevalence of respiratory ailments and the use of camphor-based products for relief |
4.3 Market Restraints |
4.3.1 Stringent regulations on the use of camphor in consumer products |
4.3.2 Limited availability of camphor-producing trees and sustainability concerns |
5 Denmark Camphor Market Trends |
6 Denmark Camphor Market, By Types |
6.1 Denmark Camphor Market, By Product Type |
6.1.1 Overview and Analysis |
6.1.2 Denmark Camphor Market Revenues & Volume, By Product Type, 2022 - 2032F |
6.1.3 Denmark Camphor Market Revenues & Volume, By Tablets, 2022 - 2032F |
6.1.4 Denmark Camphor Market Revenues & Volume, By Oil, 2022 - 2032F |
6.2 Denmark Camphor Market, By Application |
6.2.1 Overview and Analysis |
6.2.2 Denmark Camphor Market Revenues & Volume, By Pharmaceuticals, 2022 - 2032F |
6.2.3 Denmark Camphor Market Revenues & Volume, By Religious Rituals, 2022 - 2032F |
6.3 Denmark Camphor Market, By End User |
6.3.1 Overview and Analysis |
6.3.2 Denmark Camphor Market Revenues & Volume, By Healthcare, 2022 - 2032F |
6.3.3 Denmark Camphor Market Revenues & Volume, By Households, 2022 - 2032F |
6.4 Denmark Camphor Market, By Source |
6.4.1 Overview and Analysis |
6.4.2 Denmark Camphor Market Revenues & Volume, By Natural (Plant-Based), 2022 - 2032F |
6.4.3 Denmark Camphor Market Revenues & Volume, By Synthetic, 2022 - 2032F |
7 Denmark Camphor Market Import-Export Trade Statistics |
7.1 Denmark Camphor Market Export to Major Countries |
7.2 Denmark Camphor Market Imports from Major Countries |
8 Denmark Camphor Market Key Performance Indicators |
8.1 Percentage increase in the number of skincare products containing camphor |
8.2 Growth in the use of camphor in pharmaceutical preparations |
8.3 Number of research studies on the therapeutic properties of camphor conducted in Denmark |
8.4 Adoption rate of camphor-based products by health professionals in Denmark |
8.5 Consumer surveys indicating the preference for camphor-based remedies |
9 Denmark Camphor Market - Opportunity Assessment |
9.1 Denmark Camphor Market Opportunity Assessment, By Product Type, 2022 & 2032F |
9.2 Denmark Camphor Market Opportunity Assessment, By Application, 2022 & 2032F |
9.3 Denmark Camphor Market Opportunity Assessment, By End User, 2022 & 2032F |
9.4 Denmark Camphor Market Opportunity Assessment, By Source, 2022 & 2032F |
10 Denmark Camphor Market - Competitive Landscape |
10.1 Denmark Camphor Market Revenue Share, By Companies, 2025 |
10.2 Denmark Camphor Market Competitive Benchmarking, By Operating and Technical Parameters |
11 Company Profiles |
12 Recommendations |
13 Disclaimer |
Global Go To Market Strategy - 2030
Export potential enables firms to identify high-growth global markets with greater confidence by combining advanced trade intelligence with a structured quantitative methodology. The framework analyzes emerging demand trends and country-level import patterns while integrating macroeconomic and trade datasets such as GDP and population forecasts, bilateral import–export flows, tariff structures, elasticity differentials between developed and developing economies, geographic distance, and import demand projections. Using weighted trade values from 2020–2024 as the base period to project country-to-country export potential for 2030, these inputs are operationalized through calculated drivers such as gravity model parameters, tariff impact factors, and projected GDP per-capita growth. Through an analysis of hidden potentials, demand hotspots, and market conditions that are most favorable to success, this method enables firms to focus on target countries, maximize returns, and global expansion with data, backed by accuracy.
By factoring in the projected importer demand gap that is currently unmet and could be potential opportunity, it identifies the potential for the Exporter (Country) among 190 countries, against the general trade analysis, which identifies the biggest importer or exporter.
To discover high-growth global markets and optimize your business strategy:
Click Here
Pricing
- Single User License$ 1,995
- Department License$ 2,400
- Site License$ 3,120
- Global License$ 3,795

Leadership Perspectives from Industry Events
Search
Thought Leadership and Analyst Meet


Our Clients
6WResearch In News
- India Air Conditioner Market Set for Strong Rebound in 2026 After Weather-Led Correction and GST-Driven Recovery: 6Wresearch
- ADAS in India: How Automatic Emergency Braking, Blind Spot Detection & Driver Monitoring are Transforming Road Safety
- Doha a strategic location for EV manufacturing hub: IPA Qatar
- Demand for luxury TVs surging in the GCC, says Samsung
- Empowering Growth: The Thriving Journey of Bangladesh’s Cable Industry
- Demand for luxury TVs surging in the GCC, says Samsung
Latest Reports
- Poland Fire Protection Systems Market (2026-2032)
- Cape Verde Portable Hand-Thrown Extinguisher Market (2026-2032)
- Canada Portable Hand-Thrown Extinguisher Market (2026-2032)
- Cameroon Portable Hand-Thrown Extinguisher Market (2026-2032)
- Burundi Portable Hand-Thrown Extinguisher Market (2026-2032)
- Burkina Faso Portable Hand-Thrown Extinguisher Market (2026-2032)
- Bulgaria Portable Hand-Thrown Extinguisher Market (2026-2032)
- Brunei Portable Hand-Thrown Extinguisher Market (2026-2032)
- Botswana Portable Hand-Thrown Extinguisher Market (2026-2032)
- Bosnia and Herzegovina Portable Hand-Thrown Extinguisher Market (2026-2032)
Industry Events and Analyst Meet

HIMTEX 2026

India Refining Summit 2026

India EV Show 2026

EV tech India Expo 2026

Auto Tech Asia 2026
Whitepaper
- Middle East & Africa Commercial Security Market Click here to view more.
- Middle East & Africa Fire Safety Systems & Equipment Market Click here to view more.
- GCC Drone Market Click here to view more.
- Middle East Lighting Fixture Market Click here to view more.
- GCC Physical & Perimeter Security Market Click here to view more.