Japan E-Commerce App Market Size & Growth Rate
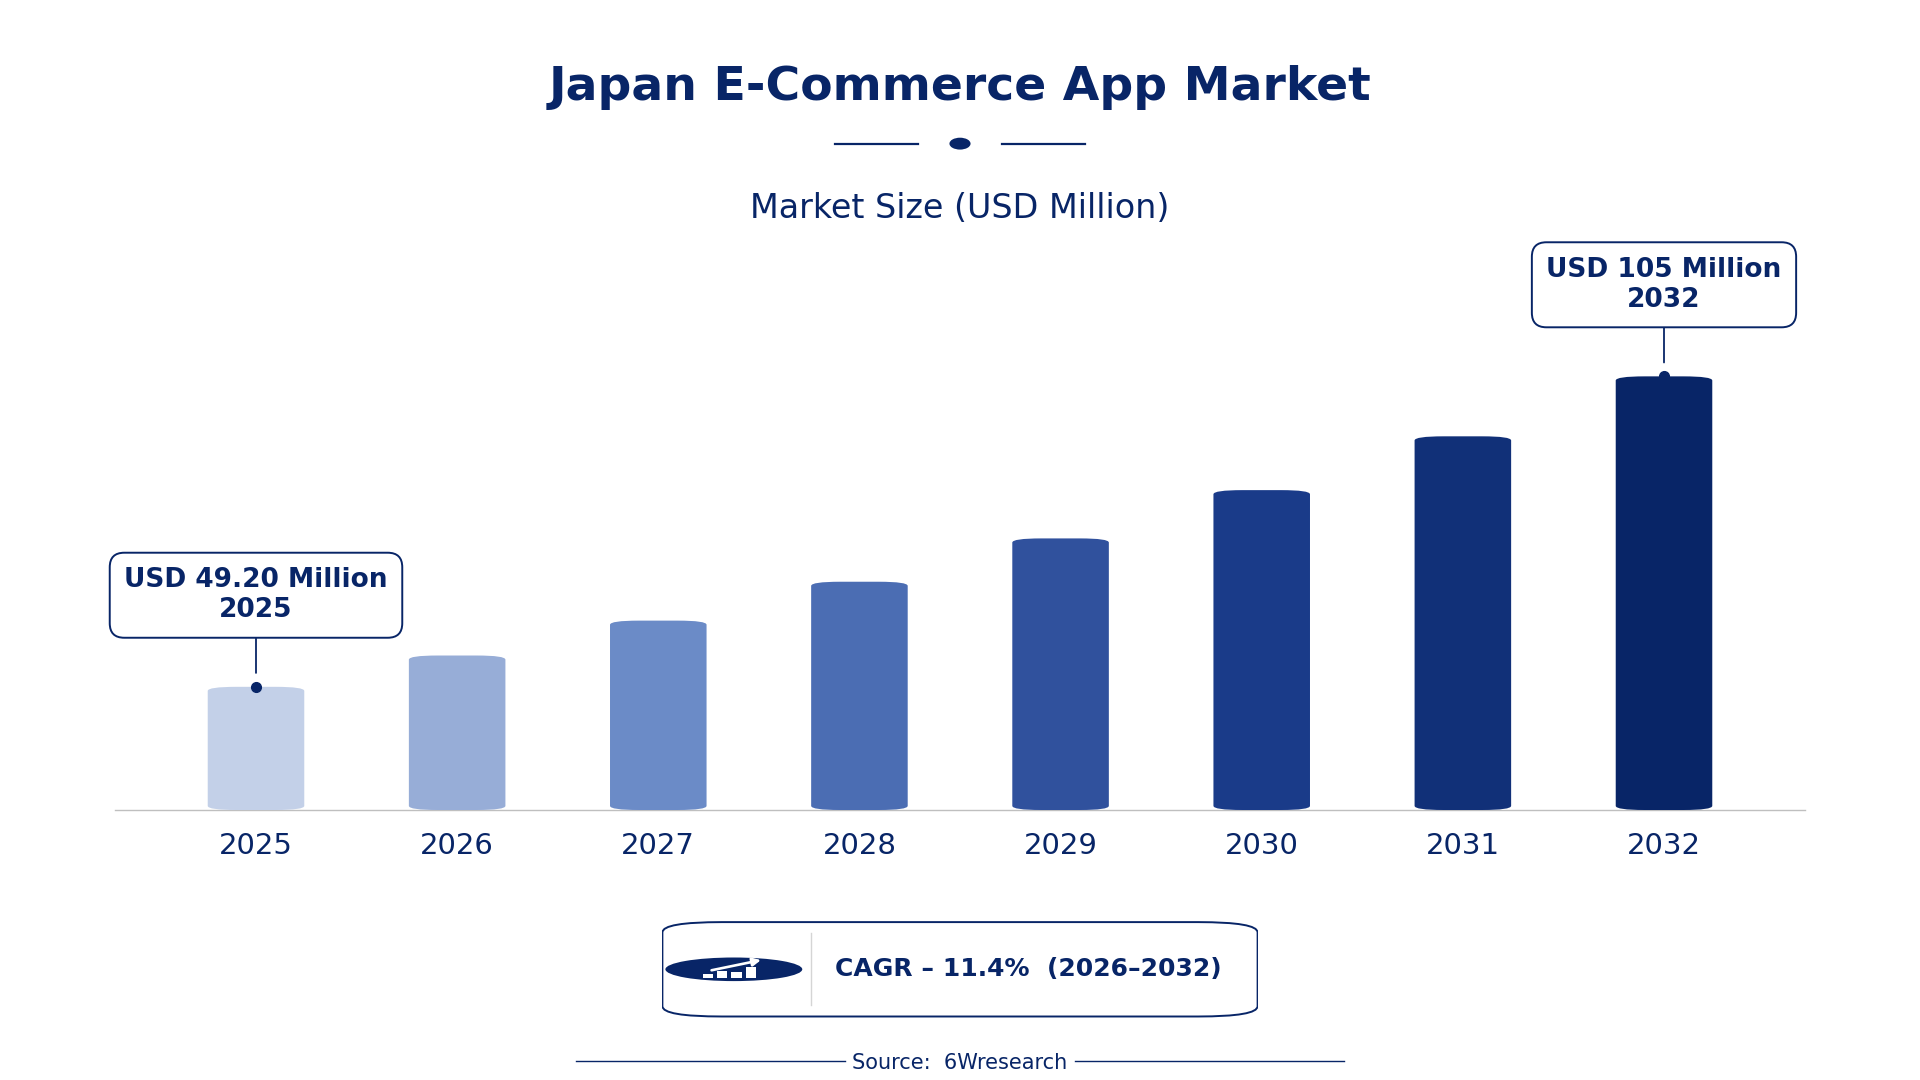
According to 6Wresearch internal database and industry insights, the Japan E-Commerce App Market was valued at USD 49.20 Million in 2025 and is projected to reach USD 105 Million by 2032, growing at a CAGR of approximately 11.4% during 2026–2032.
Japan E-Commerce App Market Highlights
| Report Metric | Details |
| Report Name | Japan E-Commerce App Market (2026-2032) |
| Market Size 2025 | USD 49.20 Million |
| Market Size 2032 | USD 105 Million |
| Absolute Growth 2025–2032 | USD 55.80 Million |
| CAGR 2026–2032 | 11.4% |
| Peak Annual Growth | 12.7% in 2031 |
| Forecast Period | 2026–2032 |
| Historical Data | 2022–2025 |
| Base Year | 2025 |
| Leading Type, 2025 | In-app Purchases (52% share) |
| Leading Platform, 2025 | Android (60% share) |
| Fastest-Growing Platform | iPhone (15.7% CAGR) |
| Growing Sector | E-commerce |
| Key End Users | Retail consumers, service providers, digital content creators |
Japan E-Commerce App Market Year-wise Growth Rate and Key Drivers (2022–2032)
This graph illustrates the annual growth rates of the market from 2022 to 2032, highlighting a steady upward trajectory and projected market expansion over the forecast period.
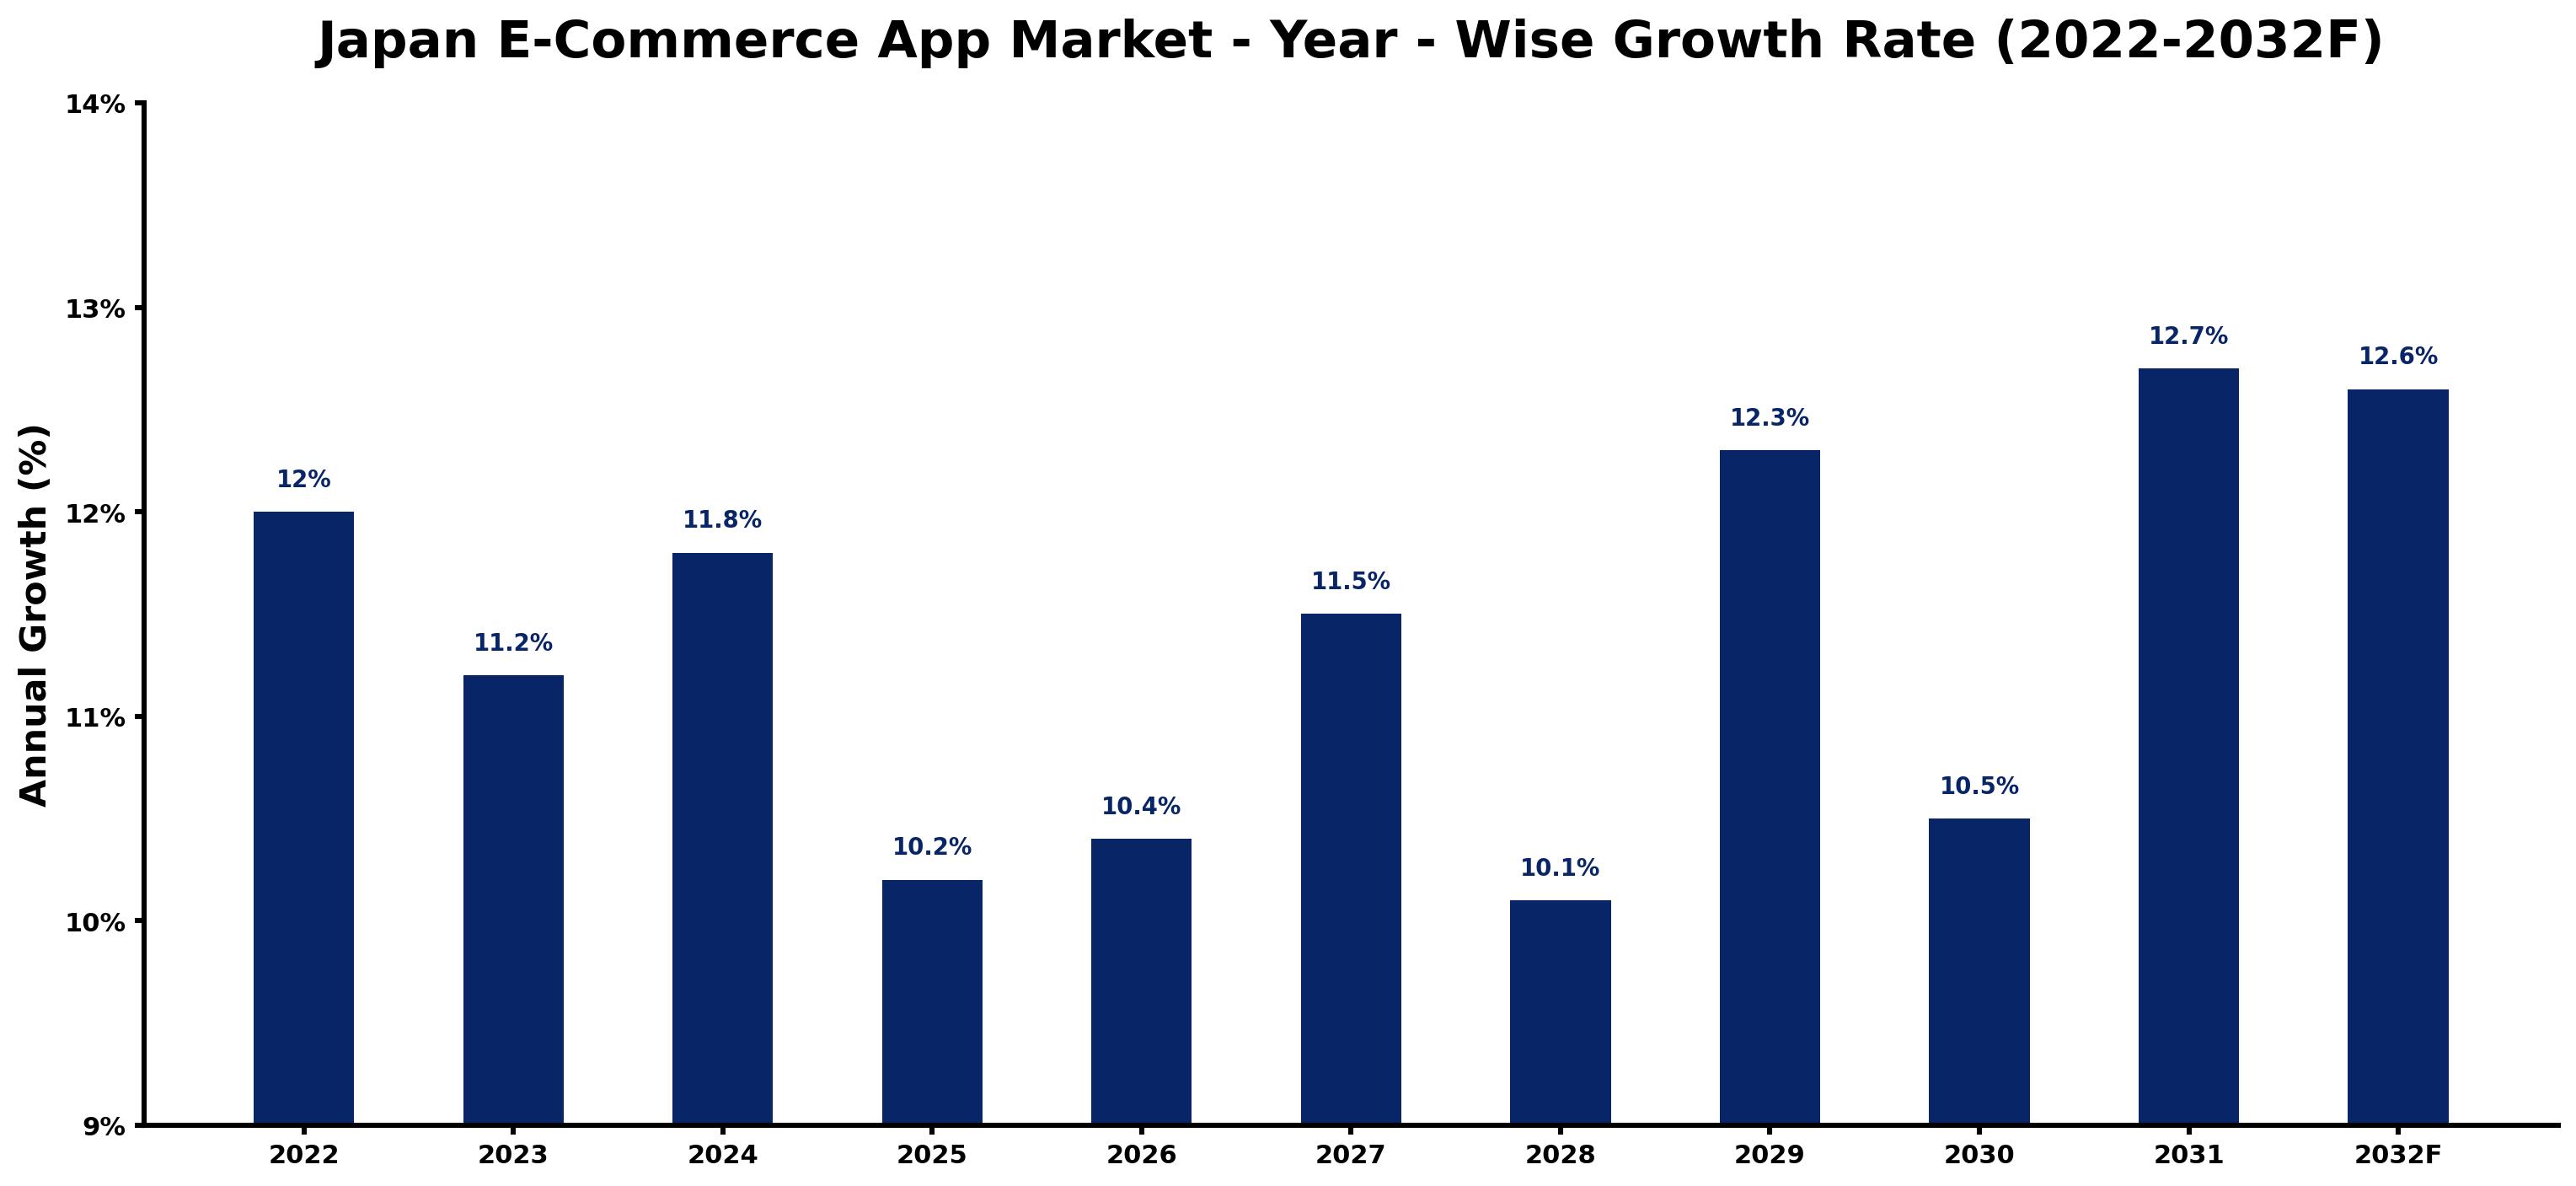
Below, each year's estimated growth is shown next to the factor that most influenced it.
| Year | Estimated Annual Growth (%) | Market Rationale |
| 2022 | 12.0 | The market showed strong online shopping habits among consumers, leading to a solid growth rate. |
| 2023 | 11.2 | Growth slowed slightly as the market adjusted to previous peaks in consumer spending. |
| 2024 | 11.8 | Increased smartphone penetration contributed to a faster growth rate as more users engaged with e-commerce apps. |
| 2025 | 10.2 | Growth slowed again as market saturation began to affect new user acquisition. |
| 2026 | 10.4 | The introduction of new features in apps is projected to stimulate growth, attracting more users. |
| 2027 | 11.5 | Increased investment in mobile commerce technology will lead to a rise in user engagement and spending. |
| 2028 | 10.1 | Growth is expected to slow as competition intensifies among e-commerce platforms, affecting overall market performance. |
| 2029 | 12.3 | A resurgence in consumer spending and promotional campaigns will drive faster growth in the market. |
| 2030 | 10.5 | Growth is anticipated to slow as the market matures and user acquisition strategies evolve. |
| 2031 | 12.7 | The introduction of new payment solutions will spur significant growth, reaching a peak. |
| 2032 | 12.6 | Growth is projected to slow slightly as the market stabilises, but demand for e-commerce apps will remain strong. |
Note: Market size estimations and growth projections presented in this report are based on 6Wresearch's proprietary forecasting methodology, utilizing the latest available industry data, government publications, and primary research inputs.
Japan E-Commerce App Market Synopsis
E-commerce apps facilitate online buying and selling, enabling retail shopping, service bookings, and digital content purchases. The Japan E-Commerce App Market is expanding, driven by high smartphone penetration and a strong consumer base, with over 80% of consumers shopping online regularly. In 2023, the market reached approximately 19 trillion yen, with mobile commerce accounting for half of total sales. Demand is further supported by technological advancements and the active involvement of the Japan E-Commerce Association in promoting best practices and improving user experiences.
Market Dynamics Impact Analysis (2026–2032)
| Factor | Type | Impact | Primary Segment Affected |
| High smartphone penetration rates drive user engagement. | Driver | High | In-app Purchases |
| Growing mobile commerce adoption increases overall sales. | Driver | High | In-app Purchases |
| Increased demand for premium app features presents investment opportunities. | Opportunity | High | In-app Purchases |
| Rising interest in loyalty programs can attract new users. | Opportunity | Medium | Other Types |
| Market saturation may limit growth potential for new entrants. | Restraint | High | In-app Purchases |
| Intense competition among apps can lead to price wars. | Restraint | Medium | In-app Purchases |
| High development costs for maintaining app security can deter smaller developers. | Challenge | High | In-app Purchases |
| Rapid technological changes require constant updates to stay competitive. | Challenge | Medium | In-app Purchases |
Evaluation of Drivers in Japan E-Commerce App Market (2026–2032)
The following drivers explain most of the expected growth.
| Drivers | Primary Segment Affected | Why It Matters (Evidence) |
| High smartphone penetration rates increase accessibility for users. | In-app Purchases | With around 125 million people in Japan, more consumers are using e-commerce apps. |
| Mobile commerce growth boosts overall e-commerce sales. | In-app Purchases | Mobile commerce accounted for 50% of total e-commerce sales in 2023, driving demand for apps. |
| Increased consumer spending on premium features raises app revenue. | In-app Purchases | The average annual spending per online shopper is about 30,000 yen, encouraging purchases of in-app features. |
| Technological advancements in payment systems improve user experience. | In-app Purchases | Integration of advanced payment gateways streamlines transactions, attracting more users. |
| Promotional campaigns and discounts stimulate user engagement. | In-app Purchases | Over 80% of Japanese consumers shop online regularly, influenced by targeted promotions. |
Several shifts outside the market lift sales. High smartphone penetration in Japan drives accessibility to e-commerce apps, boosting engagement among users. Mobile commerce accounted for half of total e-commerce sales in 2023, increasing demand for these platforms. Average annual spending per online shopper is about 30,000 yen, encouraging users to purchase premium features within apps. Technological advancements in payment systems improve user experience, attracting more consumers to engage with e-commerce applications. Promotional campaigns effectively stimulate user engagement, as a large portion of Japanese consumers shop online regularly, influencing their purchasing behaviour.
Evaluation of Restraints in Japan E-Commerce App Market
The table below lists the restraints and the evidence behind each.
| Market Restraint | Primary Segment Affected | Why It Matters (Evidence) |
| Market saturation limits growth potential for new entrants. | In-app Purchases | With over 10,000 active e-commerce apps, competition makes it difficult for newcomers to gain market share. |
| Intense competition can lead to price wars among existing apps. | In-app Purchases | As many apps vie for user attention, aggressive pricing strategies may erode profit margins. |
| High development costs for maintaining app security deter smaller developers. | In-app Purchases | Compliance with standards like ISO 27001 requires significant investment, impacting smaller players. |
| Rapid technological changes necessitate constant updates to apps. | In-app Purchases | Developers must frequently adapt to new technologies, increasing operational costs. |
| Consumer expectations for app features continuously rise, complicating development. | In-app Purchases | As users demand more advanced features, development timelines and costs can extend. |
Japan E-Commerce App Market Challenges
In 2023, delays in product availability due to logistical issues forced buyers to wait longer for their orders, potentially resulting in lost sales opportunities. Competition among over 10,000 active e-commerce apps compels suppliers to allocate more resources to marketing, which can strain their budgets. Buyers face rising costs as demand increases, leading to tighter budgets, especially since average annual spending per online shopper is around 30,000 yen. Compliance with standards like ISO 27001 creates additional operational burdens for app developers, reducing their profit margins and limiting their ability to innovate.
Trends in the Japan E-Commerce App Market
Buyers and suppliers in the Japan E-Commerce App Market are adjusting to the following trends.
- Shift from Traditional to Mobile Commerce: Since 2023, there has been a noticeable shift towards mobile commerce, particularly in urban areas like Tokyo, where mobile sales accounted for half of total e-commerce. This transition means suppliers must improve mobile app functionalities to meet consumer expectations.
- Increased Focus on In-app Purchases: Starting in 2023, e-commerce apps have increasingly integrated in-app purchase options, allowing users to buy additional features directly. This trend is reflected in the growing share of in-app purchases, projected to reach 52% by 2025.
- Emergence of Loyalty Programs: As of 2023, more e-commerce apps are implementing loyalty programs to retain users. This change is reflected in the growing interest among consumers, encouraging app developers to invest in such features.
- Adoption of Security Standards: In 2023, the adoption of ISO 27001 security standards became prevalent among e-commerce apps. This shift is important for building consumer trust and ensuring secure transactions, especially as online shopping grows.
Investment Opportunities in the Japan E-Commerce App Market
Below are the investment opportunities with the strongest case in the Japan E-Commerce App Market.
- Local Partnerships for App Development: Now is an ideal time to partner with local developers to create e-commerce apps tailored to Japanese consumers. With over 80% of consumers shopping online, there is strong demand for new features.
- Expansion of In-app Purchase Features: Investing in developing premium in-app purchase options can attract more users. The Japan E-Commerce Association highlights the growing interest in such features, indicating a strong market potential.
- Targeting Urban Areas for New Apps: Focusing on urban regions like Tokyo, where e-commerce app usage is highest, presents a lucrative opportunity. With a population exceeding 14 million, the demand for tailored e-commerce solutions is immense.
- Engaging with Digital Innovation Initiatives: Collaborating with initiatives supported by the Ministry of Economy, Trade and Industry can open avenues for funding and collaboration. The government aims to promote digital transformation, benefiting e-commerce app developers.
Government Initiatives in the Japan E-Commerce App Market
The GX Basic Policy, adopted in 2023, aims for approximately JPY 150 trillion in public-private decarbonisation investment over ten years, improving the environment for e-commerce apps. This measure complements existing regulations, such as the Industrial Standardization Act, which governs product standards and ensures quality in the e-commerce sector.
The Consumer Affairs Agency oversees the enforcement of laws that protect consumers from misleading advertising in e-commerce. This agency also approves guidelines that promote transparency in online transactions, benefiting both consumers and app developers.
Future Insight of the Japan E-Commerce App Market
By 2032, mobile commerce is projected to account for 60% of total e-commerce sales, driven by advancements in payment technologies that streamline transactions. The Digital Agency of Japan will roll out initiatives to support digital transformation, benefiting both buyers and suppliers. As the Japan E-Commerce Association promotes best practices, suppliers will invest in secure systems, enhancing consumer trust. With over 80% of Japanese consumers shopping online regularly, the growing smartphone penetration will further accelerate the adoption of e-commerce apps.
Market Segmentation Analysis
Japan E-Commerce App Market report covers a detailed analysis of the following market segments:
By Type – In-app Purchases Lead and Record the Fastest Growth
According to Vasudha, AM at 6Wresearch, in 2025, In-app Purchases led the type split with a 52% share. In-app purchases dominate the market as they provide users with the convenience of acquiring additional features or content directly within the app. This approach aligns with the behaviour of Japanese consumers, who demonstrate a strong preference for seamless and efficient online shopping experiences. The same category are also set to grow fastest, at a CAGR of 13.0% during 2026–2032. The swift expansion of in-app purchases is attributed to the high smartphone penetration rate and the increasing familiarity of users with mobile transactions. As the number of active e-commerce apps grows, the demand for enhanced functionalities through in-app purchases is expected to rise, reinforcing its market leadership. This suggests that suppliers should focus on enhancing in-app purchase capabilities to meet the evolving preferences of consumers.
By Platform – Android Leads, iPhone Expected to Grow Fastest
With 60% of platform revenue in 2025, Android was the largest category. Android holds the largest share as it serves as a primary platform for e-commerce apps, appealing to a broad user base in Japan. The extensive variety of devices available on this platform contributes to its widespread adoption among consumers. The quickest growth will come from iPhone, forecast to expand at a CAGR of 15.7% between 2026 and 2032. The iPhone platform is experiencing rapid growth due to its loyal user base and the increasing popularity of premium apps among Japanese consumers. As more high-quality e-commerce apps are developed for iPhone, its market share is likely to expand further. Suppliers must ensure their apps are optimised for both Android and iPhone to capture the widest audience possible.
Key Attractiveness of the Report
- 10 Years of Market Numbers
- Historical Data Starting from 2022 to 2025
- Base Year 2025
- Forecast Data until 2032
- Key Performance Indicators Impacting the Market
- Major Upcoming Developments and Projects
Key Highlights of the Report:
- Japan E-Commerce App Market Outlook
- Market Size of Japan E-Commerce App Market, 2025
- Forecast of Japan E-Commerce App Market, 2032
- Historical Data and Forecast of Japan E-Commerce App Revenues & Volume for the Period 2022-2032
- Japan E-Commerce App Market Trend Evolution
- Japan E-Commerce App Market Drivers and Challenges
- Japan E-Commerce App Price Trends
- Japan E-Commerce App Porter's Five Forces
- Japan E-Commerce App Industry Life Cycle
- Historical Data and Forecast of Japan E-Commerce App Market Revenues & Volume By Type for the Period 2022-2032
- Historical Data and Forecast of Japan E-Commerce App Market Revenues & Volume By In-app Purchases for the Period 2022-2032
- Historical Data and Forecast of Japan E-Commerce App Market Revenues & Volume By Advertisement for the Period 2022-2032
- Historical Data and Forecast of Japan E-Commerce App Market Revenues & Volume By Other Types for the Period 2022-2032
- Historical Data and Forecast of Japan E-Commerce App Market Revenues & Volume By Platform for the Period 2022-2032
- Historical Data and Forecast of Japan E-Commerce App Market Revenues & Volume By Android for the Period 2022-2032
- Historical Data and Forecast of Japan E-Commerce App Market Revenues & Volume By iPhone for the Period 2022-2032
- Japan E-Commerce App Import Export Trade Statistics
- Market Opportunity Assessment By Type
- Market Opportunity Assessment By Platform
- Japan E-Commerce App Top Companies Market Share
- Japan E-Commerce App Competitive Benchmarking By Technical and Operational Parameters
- Japan E-Commerce App Company Profiles
- Japan E-Commerce App Key Strategic Recommendations
Market Covered
This report examines the market across the segments below.
By Type
- In-app Purchases
- Advertisement
- Other Types
By Platform
- Android
- iPhone































