Jordan Fish Processing Market (2026-2032) | Forecast, Value, Companies, Share, Analysis, Outlook, Industry, Size, Growth, Revenue & Trends
Market Forecast By Source (Marine, Inland, Freshwater), By Application (Food, Feed, Biomedical, Others), By Processing (Frozen, Preserved, Others), By Equipment (Gutting, Scaling, Filleting, Deboning, Skinning, Curing & Smoking, Others) And Competitive Landscape
| Product Code: ETC042626 | Publication Date: Jan 2021 | Updated Date: Jun 2026 | Product Type: Report | |
| Publisher: 6Wresearch | Author: Dhaval Chaurasia | No. of Pages: 70 | No. of Figures: 35 | No. of Tables: 5 |
Jordan Fish Processing Market Summary
The jordan fish processing market was estimated at USD 1125 Million in 2025 and is projected to reach USD 1645 Million by 2032, growing at a CAGR of 6.5% from 2026 to 2032.
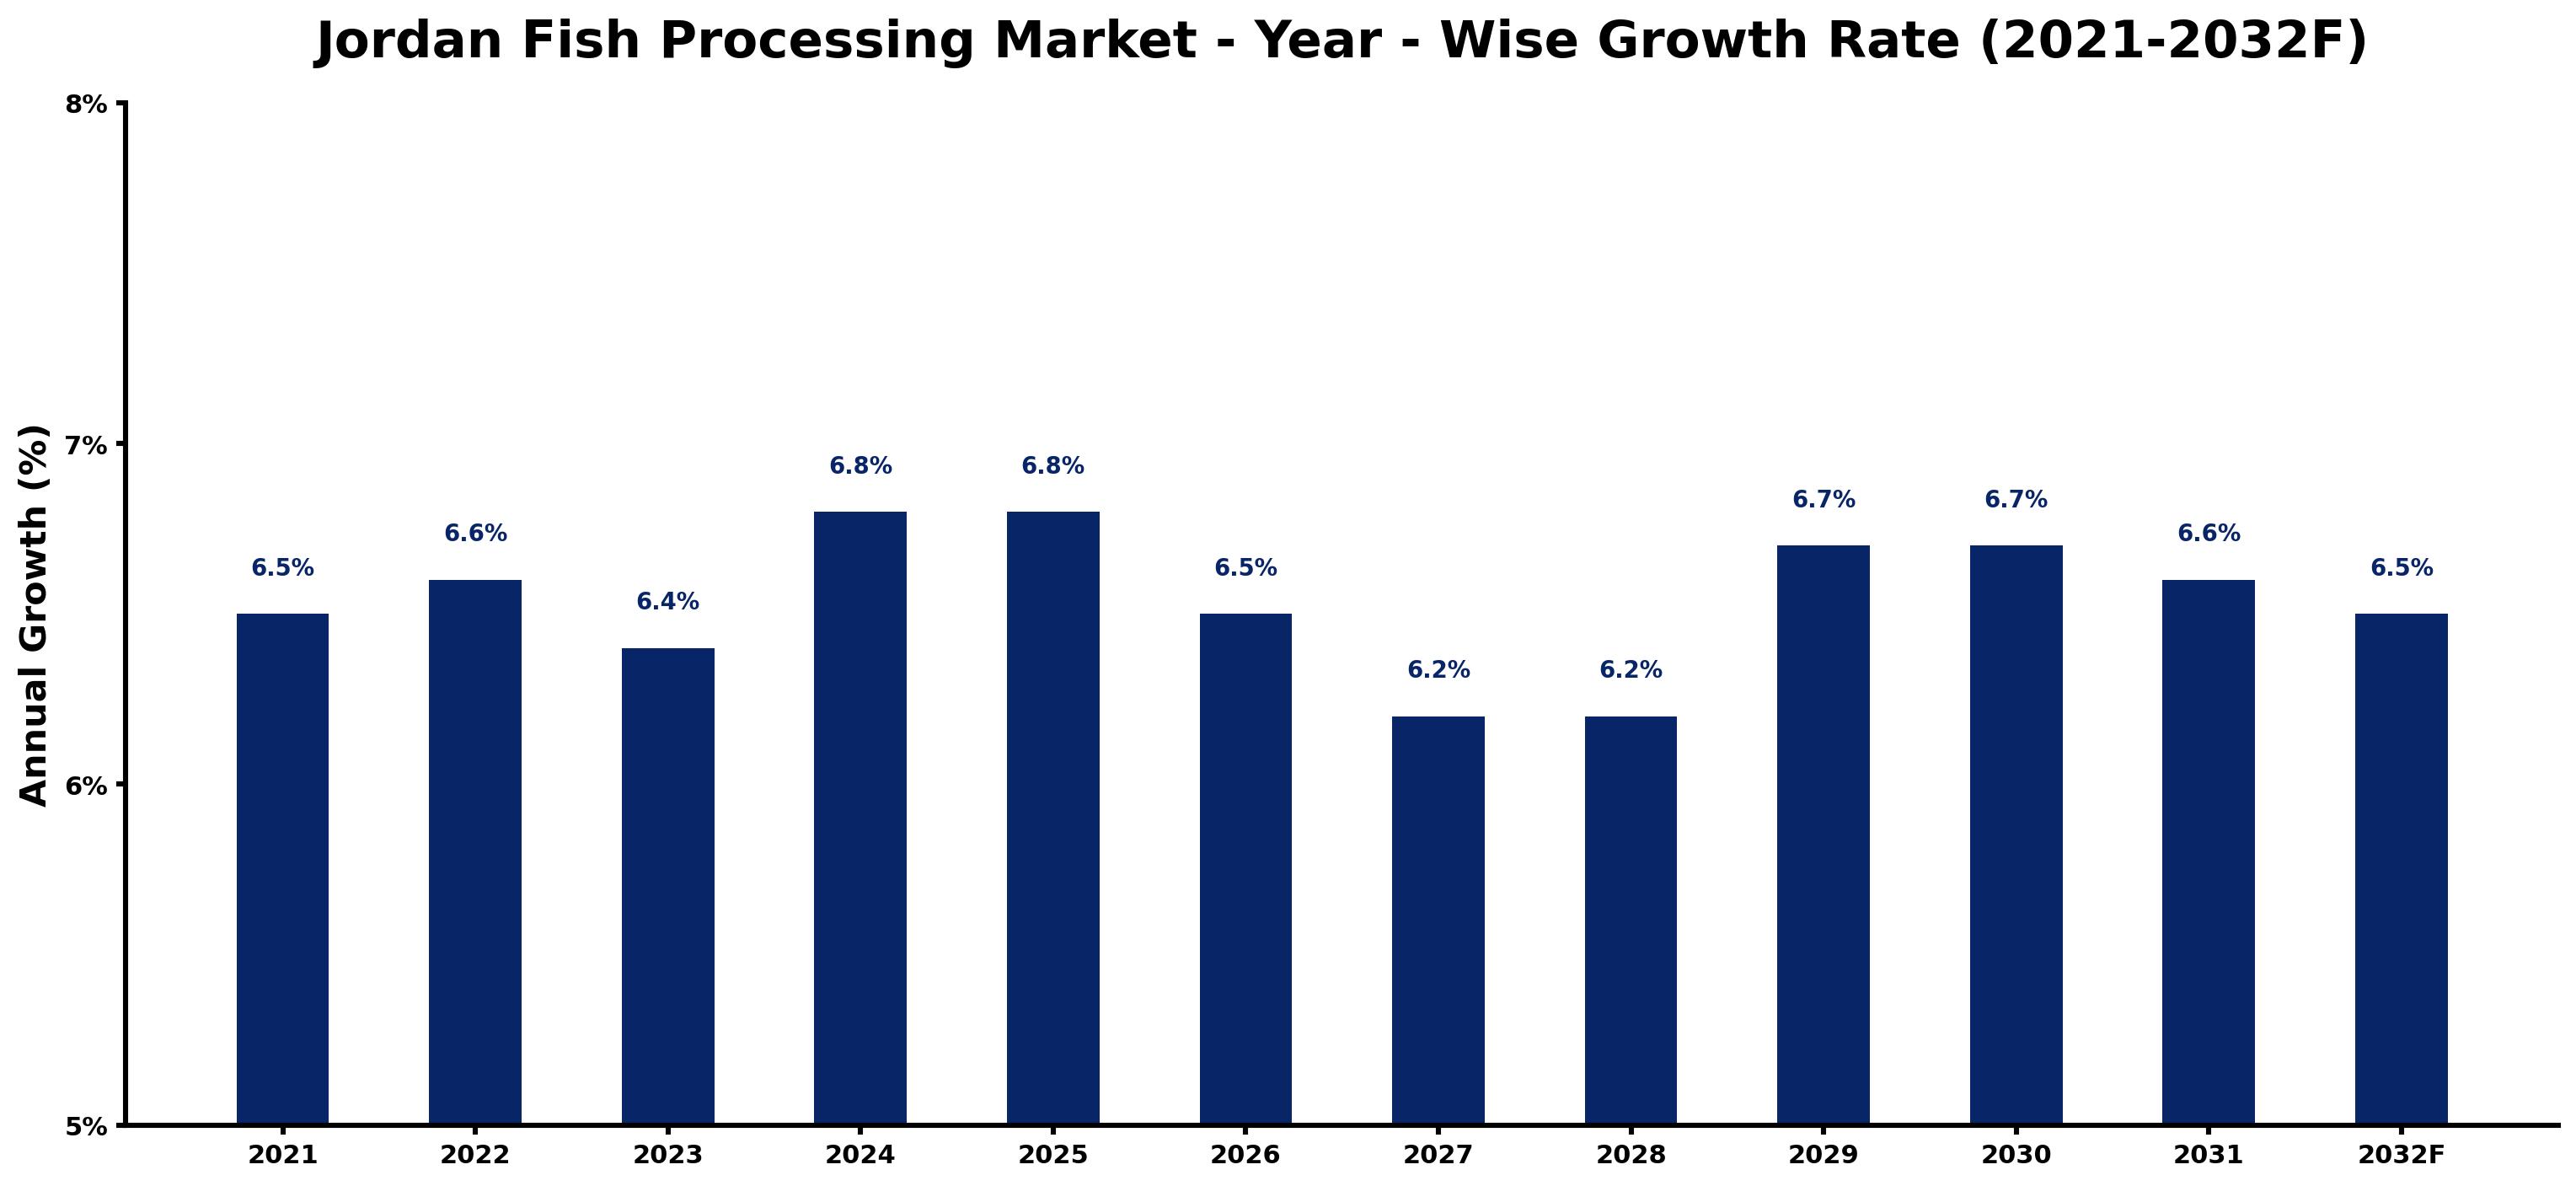
Jordan Fish Processing Market Growth Rate Analysis (2021-2032)
The Jordan Fish Processing Market has maintained a stable growth pattern, showing 6.5% growth in 2021, followed by slight variations in subsequent years, peaking at 6.8% in both 2024 and 2025. This upward trend is largely attributed to increasing consumer demand for processed fish products and significant investments in modern processing technologies that enhance production efficiency. While growth dipped slightly to 6.4% in 2023, it rebounded to 6.6% in 2031, supported by robust infrastructure development and favorable government policies aimed at promoting sustainable aquaculture practices. The market is expected to stabilize around 6.5% through 2032, reflecting a strong resilience to market fluctuations and ongoing advancements in the sector.
Jordan Fish Processing Market Year-wise Growth Rate and Key Drivers
This graph highlights how the Jordan Fish Processing Market has steadily grown over the past five years, supported by major growth factors.
The table below presents the year wise growth rates along with the key drivers influencing the market
| Year | Growth Rate | Major Drivers |
| 2021 | 6.5% | Post-COVID recovery led to increased local consumption of fish products. |
| 2022 | 6.6% | Rising interest in sustainability influenced fish processing techniques and product range. |
| 2023 | 6.4% | Tourism growth created higher demand for premium fish among international visitors. |
| 2024 | 6.8% | Local fisheries invested in modern equipment to enhance processing efficiency significantly. |
| 2025 | 6.8% | Increased health awareness shifted consumer preferences toward protein-rich fish options. |
| 2026 | 6.5% | Regional trade agreements facilitated easier access to international seafood markets. |
| 2027 | 6.2% | Technological innovations streamlined processing methods, lowering operational costs notably. |
| 2028 | 6.2% | Market players expanded distribution channels in response to evolving consumer habits. |
| 2029 | 6.7% | Branding shifts emphasized local sourcing, appealing to environmentally conscious customers. |
| 2030 | 6.7% | Emerging culinary trends incorporated fish into diverse meal options across demographics. |
| 2031 | 6.6% | Collaborations with local chefs elevated fish processing brands in the culinary scene. |
| 2032 | 6.5% | Increased export opportunities arose from developing global demand for Jordanian seafood. |
Note - Market size estimations and growth projections presented in this report are based on 6Wresearch's advanced forecasting approach, validated with industry datasets as of June 2026.
Jordan Fish Processing Market Synopsis
The Jordan Fish Processing Market is projected to reach 6.5% and witness significant growth during the forecast period (2026-2032). This growth is primarily driven by the rising consumer demand for seafood products and the increasing investments in advanced processing technologies aimed at enhancing operational efficiency and maintaining high product quality. The market encompasses a diverse range of processed fish products, including fillets, canned fish, fish meal, and fish oil, catering to both domestic and international markets.
Jordan Fish Processing Market Growth Drivers
Several factors are propelling the expansion of the Jordan Fish Processing Market. Firstly, the growing health consciousness among consumers is leading to a heightened preference for seafood, which is rich in essential nutrients. Additionally, advancements in processing technology are enabling producers to deliver higher quality products more efficiently, thus meeting consumer expectations.
- The increasing availability of seafood through both wild capture and aquaculture has broadened the supply base for fish processing, positively impacting market growth.
- Government initiatives promoting sustainable fishing practices are enhancing the long-term viability of fish stocks, allowing for continued processing activities.
- Urbanization and lifestyle changes are contributing to a surge in demand for convenient and ready-to-eat fish products, further driving market expansion.
- Growing export opportunities, particularly to regions with high seafood consumption, are encouraging investments in the fish processing sector.
- Consumer trends favoring unique and exotic fish varieties are creating new avenues for product development, enhancing the diversity within the market.
Jordan Fish Processing Market Trends and Opportunities
The Jordan Fish Processing Market is witnessing notable trends that present significant opportunities for growth. The demand for convenient, ready-to-eat fish products is escalating, as consumers seek quick meal options that align with their busy lifestyles while also being healthy.
- Technological innovations in processing and packaging are improving product shelf life and quality, aligning with consumer expectations for freshness.
- Increased awareness of environmental concerns is prompting consumers to seek sustainably sourced fish products, creating opportunities for processors to emphasize eco-friendly practices.
- Investment in value-added products, such as pre-seasoned or marinated options, is gaining traction, appealing to consumers looking for flavor and convenience.
- The trend towards health and wellness is driving the interest in fish oil and fish meal products, as they are recognized for their health benefits, especially in the dietary supplement sector.
- Regional diversification in sourcing and processing is becoming increasingly important to mitigate risks associated with climate change and resource availability.
Jordan Fish Processing Market Challenges and Restraints
Despite its growth potential, the Jordan Fish Processing Market faces several challenges that could hinder its progress. Limited access to modern processing technology remains a significant barrier, affecting productivity and efficiency levels.
- Inconsistent quality and availability of raw materials can disrupt production schedules and lead to variability in product offerings.
- Stringent regulatory frameworks governing food safety and quality require ongoing compliance efforts from processors, which can be time-consuming and costly.
- Increased competition from imported processed fish products often exerts downward pressure on prices, making it challenging for local processors to maintain margins.
- The need for skilled labor in fish processing techniques is critical, yet the industry is currently facing a shortage of trained personnel.
- Market fluctuations and changing consumer preferences necessitate continuous innovation and improvement in processing methods to keep pace with market demands.
Jordan Fish Processing Market Investment Opportunities
The Jordan Fish Processing Market presents a variety of investment opportunities for stakeholders looking to capitalize on its growth. The strategic geographical location, with access to the Red Sea and the Gulf of Aqaba, enhances the appeal of Jordan as a key player in seafood production.
- Modernizing processing facilities to boost efficiency and expand capacity can significantly enhance competitiveness in both local and export markets.
- Exploring innovative technologies for value-added products can differentiate offerings and attract a broader consumer base.
- Investing in sustainable fishing practices and acquiring relevant certifications can strengthen product appeal in environmentally aware markets.
- Forming partnerships with local fishermen and suppliers can secure a consistent supply of high-quality seafood, ensuring reliability in operations.
- Focusing on export markets and developing tailored products for international consumers can open new revenue streams, thereby enhancing overall market presence.
Jordan Fish Processing Market Government Investment and Initiatives
In Jordan, governmental policies play a crucial role in shaping the fish processing market. Regulatory bodies, including the Ministry of Agriculture and the Jordan Food and Drug Administration, are tasked with enforcing food safety standards and compliance regulations.
- There are ongoing initiatives to promote sustainable fishing practices that not only protect marine resources but also support the local fish processing industry.
- Public spending on infrastructure improvements is aimed at enhancing efficiency in the supply chain, benefiting fish processors and fishermen alike.
- Government incentives are being provided to bolster local fish processing businesses, aiming to increase domestic production capabilities and reduce reliance on imports.
- Regulations concerning the use of additives and preservatives in fish processing are in place to protect consumer health and safety.
- Trade agreements and partnerships are being pursued to facilitate better market access for Jordanian fish products at the international level, fostering export growth.
Jordan Fish Processing Market Latest Developments (May 2025 - June 2026)
During the period from May 2025 to June 2026, the Jordan Fish Processing Market has experienced notable shifts in industry direction. Emphasis on sustainable practices has intensified, with many stakeholders seeking certifications that align with global standards for eco-friendliness. Furthermore, there is an increasing push towards innovation in processing technologies, with investments aimed at enhancing product quality and operational efficiency. Consumer preferences have also evolved, with a growing inclination towards ready-to-eat options and unique fish varieties. The regulatory landscape is witnessing adaptations to better support the industry while ensuring food safety and quality. Overall, the market is positioning itself for significant future growth.
Jordan Fish Processing Market - Key Attractiveness of the Report
- 10 Years of Market Numbers
- Historical Data Starting from 2022 to 2025
- Base Year: 2025
- Forecast Data until 2032
- Key Performance Indicators Impacting the Market
- Major Upcoming Developments and Projects
Key Highlights of the Report:
- Jordan Fish Processing Market Outlook
- Market Size of Jordan Fish Processing Market, 2025
- Forecast of Jordan Fish Processing Market, 2032F
- Historical Data and Forecast of Jordan Fish Processing Revenues & Volume for the Period 2022-2032F
- Jordan Fish Processing Market Trend Evolution
- Jordan Fish Processing Market Drivers and Challenges
- Jordan Fish Processing Price Trends
- Jordan Fish Processing Porter's Five Forces
- Jordan Fish Processing Industry Life Cycle
- Historical Data and Forecast of Jordan Fish Processing Market Revenues & Volume By Source for the Period 2022-2032F
- Historical Data and Forecast of Jordan Fish Processing Market Revenues & Volume By Marine for the Period 2022-2032F
- Historical Data and Forecast of Jordan Fish Processing Market Revenues & Volume By Inland for the Period 2022-2032F
- Historical Data and Forecast of Jordan Fish Processing Market Revenues & Volume By Freshwater for the Period 2022-2032F
- Historical Data and Forecast of Jordan Fish Processing Market Revenues & Volume By Application for the Period 2022-2032F
- Historical Data and Forecast of Jordan Fish Processing Market Revenues & Volume By Food for the Period 2022-2032F
- Historical Data and Forecast of Jordan Fish Processing Market Revenues & Volume By Feed for the Period 2022-2032F
- Historical Data and Forecast of Jordan Fish Processing Market Revenues & Volume By Biomedical for the Period 2022-2032F
- Historical Data and Forecast of Jordan Fish Processing Market Revenues & Volume By Others for the Period 2022-2032F
- Historical Data and Forecast of Jordan Fish Processing Market Revenues & Volume By Processing for the Period 2022-2032F
- Historical Data and Forecast of Jordan Fish Processing Market Revenues & Volume By Frozen for the Period 2022-2032F
- Historical Data and Forecast of Jordan Fish Processing Market Revenues & Volume By Preserved for the Period 2022-2032F
- Historical Data and Forecast of Jordan Fish Processing Market Revenues & Volume By Others for the Period 2022-2032F
- Historical Data and Forecast of Jordan Fish Processing Market Revenues & Volume By Equipment for the Period 2022-2032F
- Historical Data and Forecast of Jordan Fish Processing Market Revenues & Volume By Gutting for the Period 2022-2032F
- Historical Data and Forecast of Jordan Fish Processing Market Revenues & Volume By Scaling for the Period 2022-2032F
- Historical Data and Forecast of Jordan Fish Processing Market Revenues & Volume By Filleting for the Period 2022-2032F
- Historical Data and Forecast of Jordan Fish Processing Market Revenues & Volume By Deboning for the Period 2022-2032F
- Historical Data and Forecast of Jordan Fish Processing Market Revenues & Volume By Skinning for the Period 2022-2032F
- Historical Data and Forecast of Jordan Fish Processing Market Revenues & Volume By Curing & Smoking for the Period 2022-2032F
- Historical Data and Forecast of Jordan Fish Processing Market Revenues & Volume By Others for the Period 2022-2032F
- Jordan Fish Processing Import Export Trade Statistics
- Market Opportunity Assessment By Source
- Market Opportunity Assessment By Application
- Market Opportunity Assessment By Processing
- Market Opportunity Assessment By Equipment
- Jordan Fish Processing Top Companies Market Share
- Jordan Fish Processing Competitive Benchmarking By Technical and Operational Parameters
- Jordan Fish Processing Company Profiles
- Jordan Fish Processing Key Strategic Recommendations
Frequently Asked Questions About the Market Study (FAQs):
The market is primarily driven by increasing consumer demand for seafood, advancements in processing technologies, and government initiatives promoting sustainable fishing practices.
Challenges include limited access to modern technology, inconsistent raw material supply, stringent regulations, and competition from imported products.
The Jordanian government supports the sector through regulatory oversight, funding for infrastructure improvements, and initiatives aimed at promoting sustainable practices.
Key trends include a growing demand for convenient fish products, sustainability in sourcing, and a rising interest in unique and exotic fish varieties.
6Wresearch actively monitors the Jordan Fish Processing Market and publishes its comprehensive annual report, highlighting emerging trends, growth drivers, revenue analysis, and forecast outlook. Our insights help businesses to make data-backed strategic decisions with ongoing market dynamics. Our analysts track relevent industries related to the Jordan Fish Processing Market, allowing our clients with actionable intelligence and reliable forecasts tailored to emerging regional needs.
Yes, we provide customisation as per your requirements. To learn more, feel free to contact us on sales@6wresearch.com
1 Executive Summary |
2 Introduction |
2.1 Key Highlights of the Report |
2.2 Report Description |
2.3 Market Scope & Segmentation |
2.4 Research Methodology |
2.5 Assumptions |
3 Jordan Fish Processing Market Overview |
3.1 Jordan Country Macro Economic Indicators |
3.2 Jordan Fish Processing Market Revenues & Volume, 2022 & 2032F |
3.3 Jordan Fish Processing Market - Industry Life Cycle |
3.4 Jordan Fish Processing Market - Porter's Five Forces |
3.5 Jordan Fish Processing Market Revenues & Volume Share, By Source, 2022 & 2032F |
3.6 Jordan Fish Processing Market Revenues & Volume Share, By Application, 2022 & 2032F |
3.7 Jordan Fish Processing Market Revenues & Volume Share, By Processing, 2022 & 2032F |
3.8 Jordan Fish Processing Market Revenues & Volume Share, By Equipment, 2022 & 2032F |
4 Jordan Fish Processing Market Dynamics |
4.1 Impact Analysis |
4.2 Market Drivers |
4.3 Market Restraints |
5 Jordan Fish Processing Market Trends |
6 Jordan Fish Processing Market, By Types |
6.1 Jordan Fish Processing Market, By Source |
6.1.1 Overview and Analysis |
6.1.2 Jordan Fish Processing Market Revenues & Volume, By Source, 2022-2032F |
6.1.3 Jordan Fish Processing Market Revenues & Volume, By Marine, 2022-2032F |
6.1.4 Jordan Fish Processing Market Revenues & Volume, By Inland, 2022-2032F |
6.1.5 Jordan Fish Processing Market Revenues & Volume, By Freshwater, 2022-2032F |
6.2 Jordan Fish Processing Market, By Application |
6.2.1 Overview and Analysis |
6.2.2 Jordan Fish Processing Market Revenues & Volume, By Food, 2022-2032F |
6.2.3 Jordan Fish Processing Market Revenues & Volume, By Feed, 2022-2032F |
6.2.4 Jordan Fish Processing Market Revenues & Volume, By Biomedical, 2022-2032F |
6.2.5 Jordan Fish Processing Market Revenues & Volume, By Others, 2022-2032F |
6.3 Jordan Fish Processing Market, By Processing |
6.3.1 Overview and Analysis |
6.3.2 Jordan Fish Processing Market Revenues & Volume, By Frozen, 2022-2032F |
6.3.3 Jordan Fish Processing Market Revenues & Volume, By Preserved, 2022-2032F |
6.3.4 Jordan Fish Processing Market Revenues & Volume, By Others, 2022-2032F |
6.4 Jordan Fish Processing Market, By Equipment |
6.4.1 Overview and Analysis |
6.4.2 Jordan Fish Processing Market Revenues & Volume, By Gutting, 2022-2032F |
6.4.3 Jordan Fish Processing Market Revenues & Volume, By Scaling, 2022-2032F |
6.4.4 Jordan Fish Processing Market Revenues & Volume, By Filleting, 2022-2032F |
6.4.5 Jordan Fish Processing Market Revenues & Volume, By Deboning, 2022-2032F |
6.4.6 Jordan Fish Processing Market Revenues & Volume, By Skinning, 2022-2032F |
6.4.7 Jordan Fish Processing Market Revenues & Volume, By Curing & Smoking, 2022-2032F |
7 Jordan Fish Processing Market Import-Export Trade Statistics |
7.1 Jordan Fish Processing Market Export to Major Countries |
7.2 Jordan Fish Processing Market Imports from Major Countries |
8 Jordan Fish Processing Market Key Performance Indicators |
9 Jordan Fish Processing Market - Opportunity Assessment |
9.1 Jordan Fish Processing Market Opportunity Assessment, By Source, 2022 & 2032F |
9.2 Jordan Fish Processing Market Opportunity Assessment, By Application, 2022 & 2032F |
9.3 Jordan Fish Processing Market Opportunity Assessment, By Processing, 2022 & 2032F |
9.4 Jordan Fish Processing Market Opportunity Assessment, By Equipment, 2022 & 2032F |
10 Jordan Fish Processing Market - Competitive Landscape |
10.1 Jordan Fish Processing Market Revenue Share, By Companies, 2025 |
10.2 Jordan Fish Processing Market Competitive Benchmarking, By Operating and Technical Parameters |
11 Company Profiles |
12 Recommendations |
13 Disclaimer |
Global Go To Market Strategy - 2030
Export potential enables firms to identify high-growth global markets with greater confidence by combining advanced trade intelligence with a structured quantitative methodology. The framework analyzes emerging demand trends and country-level import patterns while integrating macroeconomic and trade datasets such as GDP and population forecasts, bilateral import–export flows, tariff structures, elasticity differentials between developed and developing economies, geographic distance, and import demand projections. Using weighted trade values from 2020–2024 as the base period to project country-to-country export potential for 2030, these inputs are operationalized through calculated drivers such as gravity model parameters, tariff impact factors, and projected GDP per-capita growth. Through an analysis of hidden potentials, demand hotspots, and market conditions that are most favorable to success, this method enables firms to focus on target countries, maximize returns, and global expansion with data, backed by accuracy.
By factoring in the projected importer demand gap that is currently unmet and could be potential opportunity, it identifies the potential for the Exporter (Country) among 190 countries, against the general trade analysis, which identifies the biggest importer or exporter.
To discover high-growth global markets and optimize your business strategy:
Click Here
Pricing
- Single User License$ 1,995
- Department License$ 2,400
- Site License$ 3,120
- Global License$ 3,795

Leadership Perspectives from Industry Events
Search
Thought Leadership and Analyst Meet


Our Clients
6WResearch In News
- India Air Conditioner Market Set for Strong Rebound in 2026 After Weather-Led Correction and GST-Driven Recovery: 6Wresearch
- ADAS in India: How Automatic Emergency Braking, Blind Spot Detection & Driver Monitoring are Transforming Road Safety
- Doha a strategic location for EV manufacturing hub: IPA Qatar
- Demand for luxury TVs surging in the GCC, says Samsung
- Empowering Growth: The Thriving Journey of Bangladesh’s Cable Industry
- Demand for luxury TVs surging in the GCC, says Samsung
Latest Reports
- Poland Fire Protection Systems Market (2026-2032)
- Cape Verde Portable Hand-Thrown Extinguisher Market (2026-2032)
- Canada Portable Hand-Thrown Extinguisher Market (2026-2032)
- Cameroon Portable Hand-Thrown Extinguisher Market (2026-2032)
- Burundi Portable Hand-Thrown Extinguisher Market (2026-2032)
- Burkina Faso Portable Hand-Thrown Extinguisher Market (2026-2032)
- Bulgaria Portable Hand-Thrown Extinguisher Market (2026-2032)
- Brunei Portable Hand-Thrown Extinguisher Market (2026-2032)
- Botswana Portable Hand-Thrown Extinguisher Market (2026-2032)
- Bosnia and Herzegovina Portable Hand-Thrown Extinguisher Market (2026-2032)
Industry Events and Analyst Meet

HIMTEX 2026

India Refining Summit 2026

India EV Show 2026

EV tech India Expo 2026

Auto Tech Asia 2026
Whitepaper
- Middle East & Africa Commercial Security Market Click here to view more.
- Middle East & Africa Fire Safety Systems & Equipment Market Click here to view more.
- GCC Drone Market Click here to view more.
- Middle East Lighting Fixture Market Click here to view more.
- GCC Physical & Perimeter Security Market Click here to view more.