Kenya Textile Waste Market (2026-2032) | Outlook, COVID-19 IMPACT, Analysis, Share, Value, Size, Trends, Growth, Industry, Revenue, Forecast & Companies
Market Forecast By Solution Types (Source Reduction Solutions, Landfills Solutions, Recycling Solutions, Incineration Solutions), By Product Types (Spinning waste, Weaving waste, Knitting waste, Dyeing waste, Clothing waste, Consumer waste) And Competitive Landscape
| Product Code: ETC007750 | Publication Date: Jun 2023 | Product Type: Report | ||
| Publisher: 6Wresearch | Author: Ravi Bhandari | No. of Pages: 70 | No. of Figures: 35 | No. of Tables: 5 |
Kenya Textile Waste Market Summary
The kenya textile waste market was estimated at USD 160 Million in 2025 and is projected to reach USD 214 Million by 2032, growing at a CAGR of 5.2% from 2026 to 2032.
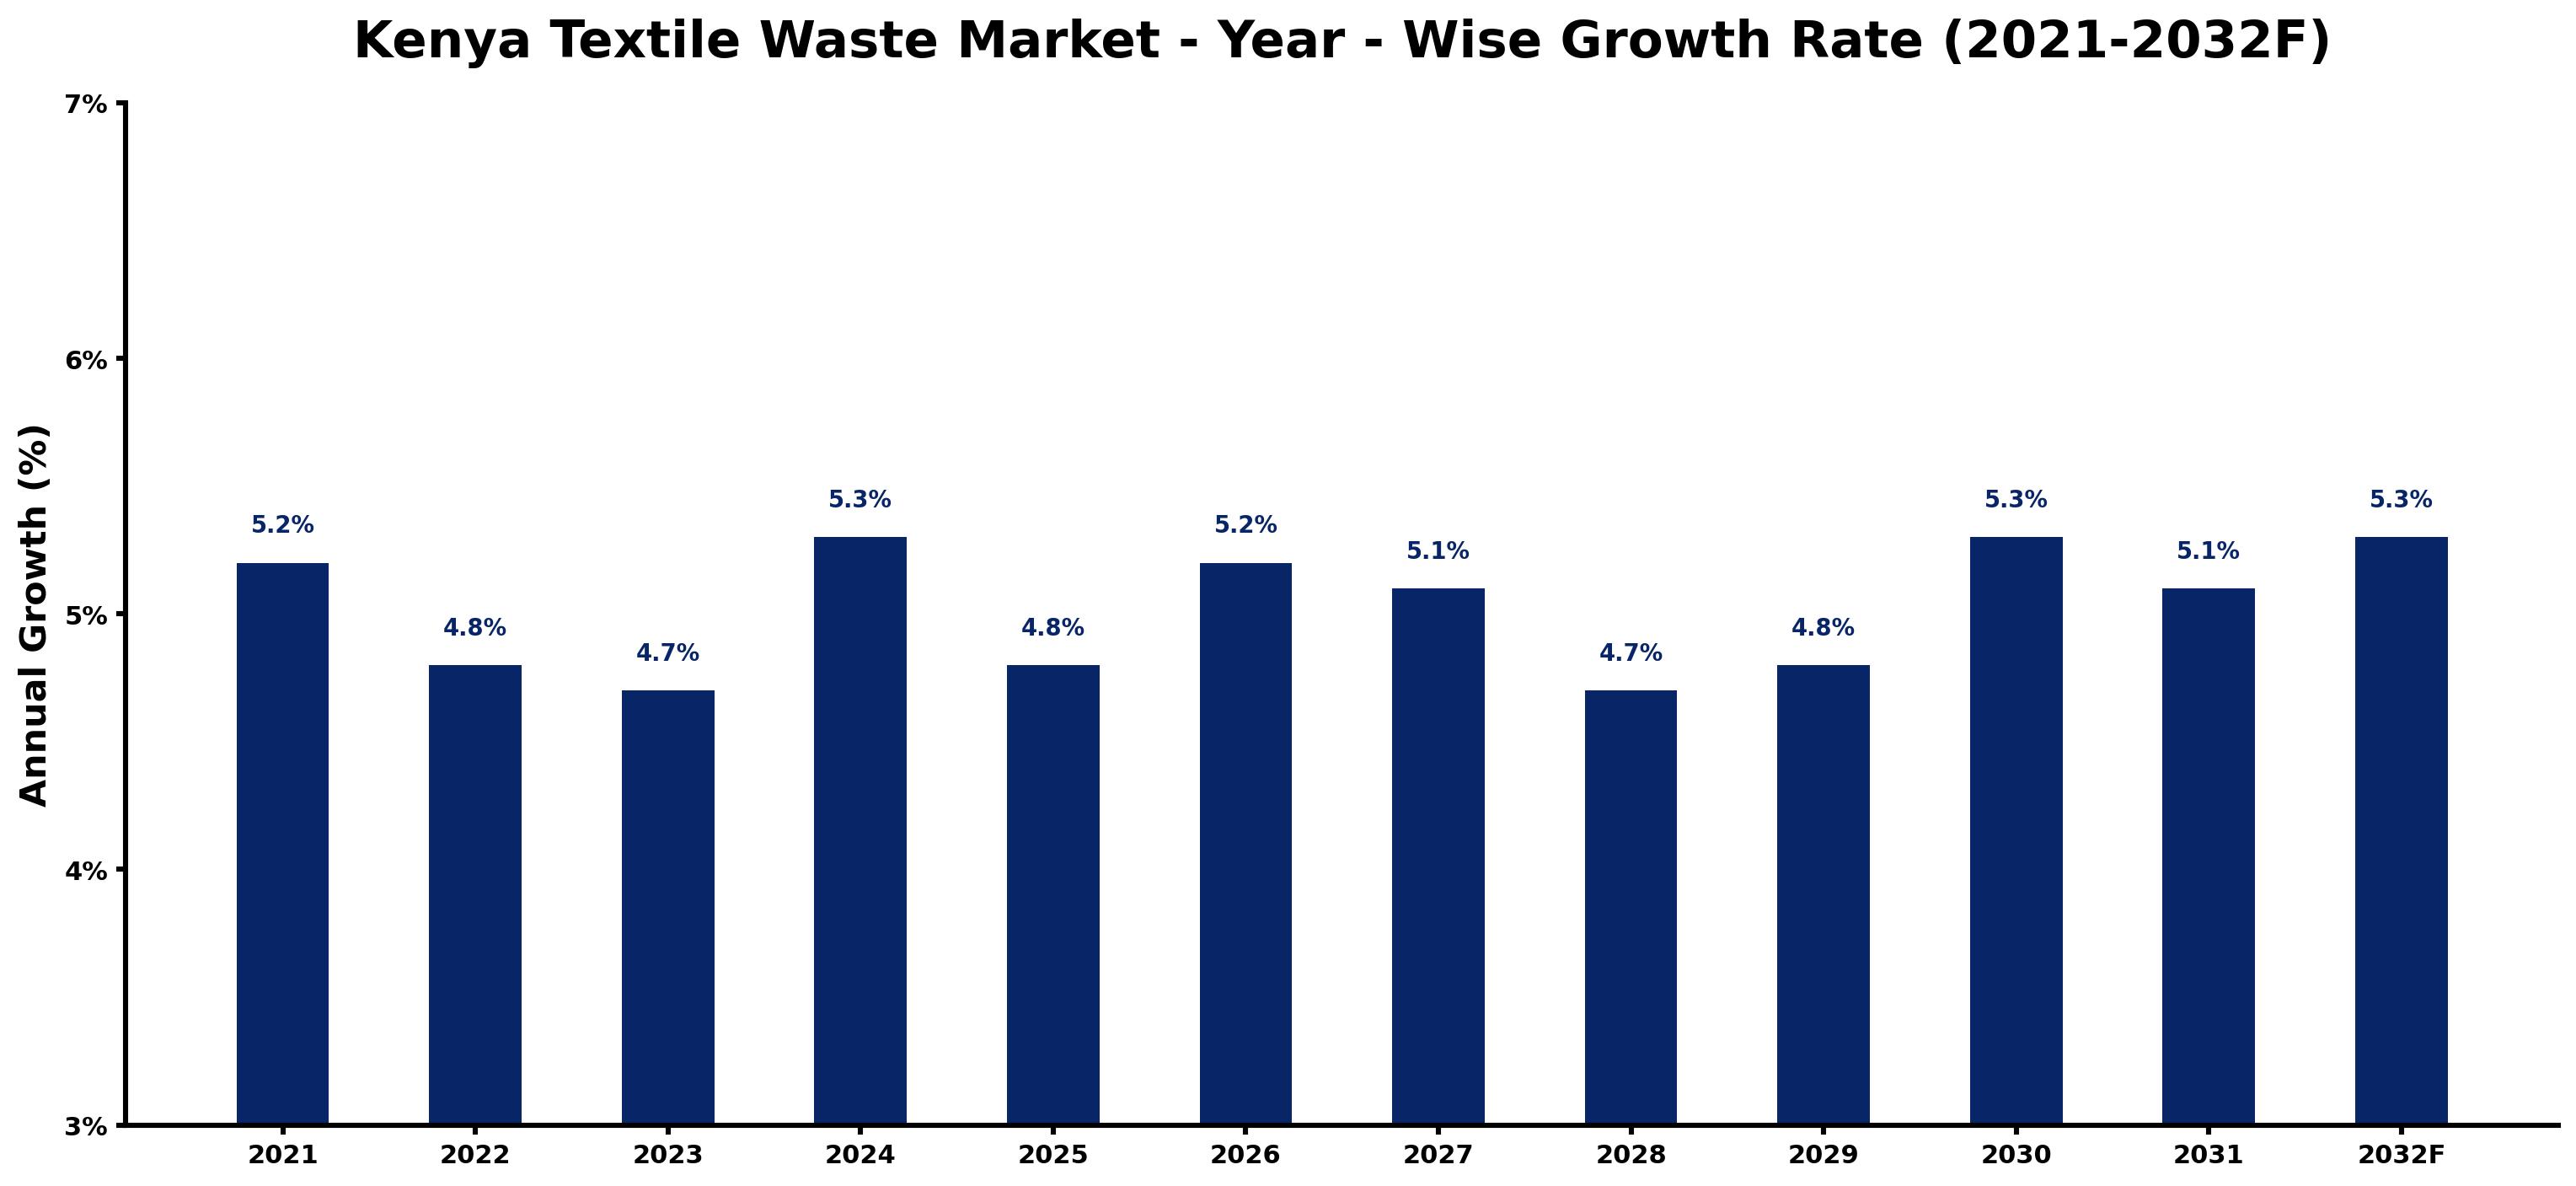
Kenya Textile Waste Market Growth Rate Analysis (2021-2032)
The Kenya Textile Waste Market has maintained a relatively stable growth pattern, reflected in its yearly growth rates of 5.2% in 2021, gradually declining to 4.7% in 2023 before experiencing a rebound to 5.3% in 2024 and maintaining a consistent pace through 2032. Factors such as increasing consumer demand for sustainable practices and investments in waste management technologies have positively influenced this market. However, minor fluctuations, particularly in 2022 and 2028 with declines to 4.8% and 4.7%, can be attributed to shifts in policy and infrastructure challenges. As the country focuses on energy transition and digitalization, the textile waste sector is positioned to capitalize on these trends, driving growth and innovation.
Kenya Textile Waste Market Year-wise Growth Rate and Key Drivers
This graph highlights how the Kenya Textile Waste Market has steadily grown over the past five years, supported by major growth factors.
The table below presents the year wise growth rates along with the key drivers influencing the market
| Year | Growth Rate | Major Drivers |
| 2021 | 5.2% | Textile waste management gained attention as sustainability trends permeated consumer behavior. |
| 2022 | 4.8% | Local entrepreneurs began transforming waste into fashion, introducing circular economy concepts. |
| 2023 | 4.7% | Collaborations between NGOs and brands focused on educating communities about recycling benefits. |
| 2024 | 5.3% | The emergence of eco-friendly brands prompted traditional firms to rethink waste strategies. |
| 2025 | 4.8% | New technologies in textile recycling made processes more efficient and cost-effective. |
| 2026 | 5.2% | Increased investment in waste-to-energy projects provided additional channels for textile waste. |
| 2027 | 5.1% | International partnerships led to knowledge transfer, boosting local textile recycling capabilities. |
| 2028 | 4.7% | Urbanization trends created higher textile waste volumes, attracting startup innovations in recycling. |
| 2029 | 4.8% | Rising awareness of environmental issues shaped consumer preferences towards recycled products. |
| 2030 | 5.3% | Emerging regulations incentivized companies to adopt sustainable practices, reducing textile waste. |
| 2031 | 5.1% | Corporate social responsibility initiatives began emphasizing textile recycling among multinational firms. |
| 2032 | 5.3% | Circular fashion movements fostered partnerships, significantly increasing the local textile waste market. |
Note - Market size estimations and growth projections presented in this report are based on 6Wresearch's advanced forecasting approach, validated with industry datasets as of June 2026.
Kenya Textile Waste Market Synopsis
The Kenya Textile Waste Market is projected to reach 5.2% and witness significant growth during the forecast period (2026-2032). This development is primarily driven by the increasing demand for recycled textiles, alongside rising consumer concerns regarding environmental sustainability. Government initiatives aimed at promoting the recycling sector, coupled with growing investments in cutting-edge technologies such as artificial intelligence (AI), are further propelling market growth. Additionally, factors including higher income levels, rapid urbanization, and evolving consumer preferences are stimulating the expansion of this market across East Africa.
Kenya Textile Waste Market Growth Drivers
The growth of the Kenya Textile Waste Market can be attributed to several key drivers:
- Increasing Demand for Recycled Textiles: As consumers become more conscious of environmental issues, the demand for recycled textiles is rising. This trend is pushing manufacturers to innovate and enhance their recycling processes.
- Government Support for Recycling Initiatives: The Kenyan government has implemented numerous initiatives to support recycling efforts, including policies that encourage investment in recycling facilities and infrastructure development.
- Technological Advancements: The integration of AI and other emerging technologies in the textile industry is improving efficiency and the quality of recycled materials, thereby appealing to manufacturers and consumers alike.
- Changing Consumer Preferences: A significant shift towards sustainable fashion is being observed, with consumers increasingly opting for brands that prioritize eco-friendly practices and waste reduction.
- Urbanization and Increased Income Levels: Rapid urbanization, coupled with rising disposable incomes, is creating a larger customer base that is more likely to invest in sustainable products, stimulating market growth.
Kenya Textile Waste Market Trends and Opportunities
Several trends are shaping the Kenya Textile Waste Market, presenting opportunities for growth:
- Expansion of Circular Economy Models: The adoption of circular economy principles is gaining traction, encouraging businesses to utilize textile waste as a resource, thus minimizing environmental impact.
- Innovations in Waste Management Technologies: Ongoing research and development in waste management technologies promise increased efficiency in textile recycling, attracting further investment.
- Collaboration Across Industries: Partnerships between fashion brands, recycling companies, and technology developers are emerging to address textile waste more effectively and sustainably.
- Consumer Education Campaigns: Increased awareness campaigns focused on sustainable fashion practices are influencing consumer behavior, fostering a greater acceptance of recycled textiles.
- Investment in Infrastructure Development: There is a growing focus on building recycling facilities in key urban areas, which will bolster the capacity to handle textile waste effectively.
Kenya Textile Waste Market Challenges and Restraints
Despite its promising outlook, the Kenya Textile Waste Market faces several challenges that could hinder its growth:
- Lack of Awareness About Sustainable Products: Many consumers remain unaware of the benefits of sustainable fashion, which limits market penetration for recycled textile products.
- Slow Adoption of Innovative Technologies: The pace of adopting advanced recycling technologies is slower than necessary, limiting efficiency improvements in the sector.
- Regulatory Challenges: Stringent regulations related to trade policies and environmental requirements may create barriers for new entrants and existing players looking to innovate.
- Inconsistent Supply of Raw Materials: The fluctuating supply of textile waste can lead to challenges in maintaining production levels in recycling facilities.
- Economic Instability: Economic fluctuations can affect consumer spending on sustainable products, impacting overall market growth.
Kenya Textile Waste Market Government Investment and Initiatives
The Kenyan government plays a crucial role in fostering the growth of the textile waste market through various initiatives and investments:
- Policy Framework for Sustainable Practices: The government has established a regulatory framework aimed at promoting sustainable practices in the textile industry, encouraging stakeholders to adopt recycling methods.
- Incentives for Recycling Industries: Financial incentives and grants are available to companies investing in recycling technologies and facilities, supporting the expansion of the textile waste market.
- Promotion of Educational Campaigns: The government is actively involved in educational campaigns to raise awareness about the importance of recycling and sustainable fashion among consumers.
- Collaboration with NGOs and International Organizations: Partnerships with non-governmental organizations and international bodies are enhancing efforts to manage textile waste effectively, fostering innovation in the sector.
- Investment in Waste Management Infrastructure: Ongoing investment in improving waste management infrastructure is crucial for the efficient collection, sorting, and recycling of textile waste.
Kenya Textile Waste Market Latest Developments (May 2025 - June 2026)
Recent developments within the Kenya Textile Waste Market indicate a strong movement towards innovation and environmental sustainability:
- Launch of New Recycling Programs: Initiatives aimed at increasing the volume of textile waste collected for recycling have been launched, reflecting growing awareness and participation from local communities.
- Technological Innovations in Textile Recycling: Companies are increasingly adopting advanced technologies to streamline recycling processes, improving the quality of recycled textiles.
- Emergence of Sustainable Fashion Brands: A rise in local fashion brands focusing on sustainability is noted, contributing to the market growth and consumer acceptance of recycled products.
- Community Engagement Initiatives: Various organizations have implemented programs to educate the public on the importance of textile recycling, fostering a culture of sustainability.
- International Partnerships: Collaborative efforts with global partners are being established to share best practices and solutions for effective textile waste management.
Kenya Textile Waste Market - Key Attractiveness of the Report
- 10 Years of Market Numbers
- Historical Data Starting from 2022 to 2025
- Base Year: 2025
- Forecast Data until 2032
- Key Performance Indicators Impacting the Market
- Major Upcoming Developments and Projects
Key Highlights of the Report:
- Kenya Textile Waste Market Outlook
- Market Size of Kenya Textile Waste Market, 2025
- Forecast of Kenya Textile Waste Market, 2032F
- Historical Data and Forecast of Kenya Textile Waste Revenues & Volume for the Period 2022-2032F
- Kenya Textile Waste Market Trend Evolution
- Kenya Textile Waste Market Drivers and Challenges
- Kenya Textile Waste Price Trends
- Kenya Textile Waste Porter's Five Forces
- Kenya Textile Waste Industry Life Cycle
- Historical Data and Forecast of Kenya Textile Waste Market Revenues & Volume By Solution Types for the Period 2022-2032F
- Historical Data and Forecast of Kenya Textile Waste Market Revenues & Volume By Source Reduction Solutions for the Period 2022-2032F
- Historical Data and Forecast of Kenya Textile Waste Market Revenues & Volume By Landfills Solutions for the Period 2022-2032F
- Historical Data and Forecast of Kenya Textile Waste Market Revenues & Volume By Recycling Solutions for the Period 2022-2032F
- Historical Data and Forecast of Kenya Textile Waste Market Revenues & Volume By Incineration Solutions for the Period 2022-2032F
- Historical Data and Forecast of Kenya Textile Waste Market Revenues & Volume By Product Types for the Period 2022-2032F
- Historical Data and Forecast of Kenya Textile Waste Market Revenues & Volume By Spinning waste for the Period 2022-2032F
- Historical Data and Forecast of Kenya Textile Waste Market Revenues & Volume By Weaving waste for the Period 2022-2032F
- Historical Data and Forecast of Kenya Textile Waste Market Revenues & Volume By Knitting waste for the Period 2022-2032F
- Historical Data and Forecast of Kenya Textile Waste Market Revenues & Volume By Dyeing waste for the Period 2022-2032F
- Historical Data and Forecast of Kenya Textile Waste Market Revenues & Volume By Clothing waste for the Period 2022-2032F
- Historical Data and Forecast of Kenya Textile Waste Market Revenues & Volume By Consumer waste for the Period 2022-2032F
- Kenya Textile Waste Import Export Trade Statistics
- Market Opportunity Assessment By Solution Types
- Market Opportunity Assessment By Product Types
- Kenya Textile Waste Top Companies Market Share
- Kenya Textile Waste Competitive Benchmarking By Technical and Operational Parameters
- Kenya Textile Waste Company Profiles
- Kenya Textile Waste Key Strategic Recommendations
Frequently Asked Questions About the Market Study (FAQs):
The market is primarily driven by increased demand for recycled textiles, growing awareness of sustainability, and government support.
Emerging technologies, including AI, are anticipated to enhance recycling processes and improve the quality of recycled textile products.
Significant challenges include a lack of awareness regarding sustainable fashion, slow technology adoption, and inconsistent supply of raw materials.
The government supports the sector through policies, incentives for recycling initiatives, and investment in waste management infrastructure.
6Wresearch actively monitors the Kenya Textile Waste Market and publishes its comprehensive annual report, highlighting emerging trends, growth drivers, revenue analysis, and forecast outlook. Our insights help businesses to make data-backed strategic decisions with ongoing market dynamics. Our analysts track relevent industries related to the Kenya Textile Waste Market, allowing our clients with actionable intelligence and reliable forecasts tailored to emerging regional needs.
Yes, we provide customisation as per your requirements. To learn more, feel free to contact us on sales@6wresearch.com
1 Executive Summary |
2 Introduction |
2.1 Key Highlights of the Report |
2.2 Report Description |
2.3 Market Scope & Segmentation |
2.4 Research Methodology |
2.5 Assumptions |
3 Kenya Textile Waste Market Overview |
3.1 Kenya Country Macro Economic Indicators |
3.2 Kenya Textile Waste Market Revenues & Volume, 2022 & 2032F |
3.3 Kenya Textile Waste Market - Industry Life Cycle |
3.4 Kenya Textile Waste Market - Porter's Five Forces |
3.5 Kenya Textile Waste Market Revenues & Volume Share, By Solution Types, 2022 & 2032F |
3.6 Kenya Textile Waste Market Revenues & Volume Share, By Product Types, 2022 & 2032F |
4 Kenya Textile Waste Market Dynamics |
4.1 Impact Analysis |
4.2 Market Drivers |
4.3 Market Restraints |
5 Kenya Textile Waste Market Trends |
6 Kenya Textile Waste Market, By Types |
6.1 Kenya Textile Waste Market, By Solution Types |
6.1.1 Overview and Analysis |
6.1.2 Kenya Textile Waste Market Revenues & Volume, By Solution Types, 2022-2032F |
6.1.3 Kenya Textile Waste Market Revenues & Volume, By Source Reduction Solutions, 2022-2032F |
6.1.4 Kenya Textile Waste Market Revenues & Volume, By Landfills Solutions, 2022-2032F |
6.1.5 Kenya Textile Waste Market Revenues & Volume, By Recycling Solutions, 2022-2032F |
6.1.6 Kenya Textile Waste Market Revenues & Volume, By Incineration Solutions, 2022-2032F |
6.2 Kenya Textile Waste Market, By Product Types |
6.2.1 Overview and Analysis |
6.2.2 Kenya Textile Waste Market Revenues & Volume, By Spinning waste, 2022-2032F |
6.2.3 Kenya Textile Waste Market Revenues & Volume, By Weaving waste, 2022-2032F |
6.2.4 Kenya Textile Waste Market Revenues & Volume, By Knitting waste, 2022-2032F |
6.2.5 Kenya Textile Waste Market Revenues & Volume, By Dyeing waste, 2022-2032F |
6.2.6 Kenya Textile Waste Market Revenues & Volume, By Clothing waste, 2022-2032F |
6.2.7 Kenya Textile Waste Market Revenues & Volume, By Consumer waste, 2022-2032F |
7 Kenya Textile Waste Market Import-Export Trade Statistics |
7.1 Kenya Textile Waste Market Export to Major Countries |
7.2 Kenya Textile Waste Market Imports from Major Countries |
8 Kenya Textile Waste Market Key Performance Indicators |
9 Kenya Textile Waste Market - Opportunity Assessment |
9.1 Kenya Textile Waste Market Opportunity Assessment, By Solution Types, 2022 & 2032F |
9.2 Kenya Textile Waste Market Opportunity Assessment, By Product Types, 2022 & 2032F |
10 Kenya Textile Waste Market - Competitive Landscape |
10.1 Kenya Textile Waste Market Revenue Share, By Companies, 2025 |
10.2 Kenya Textile Waste Market Competitive Benchmarking, By Operating and Technical Parameters |
11 Company Profiles |
12 Recommendations |
13 Disclaimer |
Global Go To Market Strategy - 2030
Export potential enables firms to identify high-growth global markets with greater confidence by combining advanced trade intelligence with a structured quantitative methodology. The framework analyzes emerging demand trends and country-level import patterns while integrating macroeconomic and trade datasets such as GDP and population forecasts, bilateral import–export flows, tariff structures, elasticity differentials between developed and developing economies, geographic distance, and import demand projections. Using weighted trade values from 2020–2024 as the base period to project country-to-country export potential for 2030, these inputs are operationalized through calculated drivers such as gravity model parameters, tariff impact factors, and projected GDP per-capita growth. Through an analysis of hidden potentials, demand hotspots, and market conditions that are most favorable to success, this method enables firms to focus on target countries, maximize returns, and global expansion with data, backed by accuracy.
By factoring in the projected importer demand gap that is currently unmet and could be potential opportunity, it identifies the potential for the Exporter (Country) among 190 countries, against the general trade analysis, which identifies the biggest importer or exporter.
To discover high-growth global markets and optimize your business strategy:
Click Here
Pricing
- Single User License$ 1,995
- Department License$ 2,400
- Site License$ 3,120
- Global License$ 3,795

Leadership Perspectives from Industry Events
Search
Thought Leadership and Analyst Meet


Our Clients
6WResearch In News
- India Air Conditioner Market Set for Strong Rebound in 2026 After Weather-Led Correction and GST-Driven Recovery: 6Wresearch
- ADAS in India: How Automatic Emergency Braking, Blind Spot Detection & Driver Monitoring are Transforming Road Safety
- Doha a strategic location for EV manufacturing hub: IPA Qatar
- Demand for luxury TVs surging in the GCC, says Samsung
- Empowering Growth: The Thriving Journey of Bangladesh’s Cable Industry
- Demand for luxury TVs surging in the GCC, says Samsung
Latest Reports
- Poland Fire Protection Systems Market (2026-2032)
- Cape Verde Portable Hand-Thrown Extinguisher Market (2026-2032)
- Canada Portable Hand-Thrown Extinguisher Market (2026-2032)
- Cameroon Portable Hand-Thrown Extinguisher Market (2026-2032)
- Burundi Portable Hand-Thrown Extinguisher Market (2026-2032)
- Burkina Faso Portable Hand-Thrown Extinguisher Market (2026-2032)
- Bulgaria Portable Hand-Thrown Extinguisher Market (2026-2032)
- Brunei Portable Hand-Thrown Extinguisher Market (2026-2032)
- Botswana Portable Hand-Thrown Extinguisher Market (2026-2032)
- Bosnia and Herzegovina Portable Hand-Thrown Extinguisher Market (2026-2032)
Industry Events and Analyst Meet

HIMTEX 2026

India Refining Summit 2026

India EV Show 2026

EV tech India Expo 2026

Auto Tech Asia 2026
Whitepaper
- Middle East & Africa Commercial Security Market Click here to view more.
- Middle East & Africa Fire Safety Systems & Equipment Market Click here to view more.
- GCC Drone Market Click here to view more.
- Middle East Lighting Fixture Market Click here to view more.
- GCC Physical & Perimeter Security Market Click here to view more.