Oman Video Game Accessories Market (2026-2032) | Growth, Industry, Revenue, Share, Size, Trends, Forecast, Companies, Value, Outlook & Analysis
Market Forecast By Product Type (Gamepads, Keyboards, Mice, Headset, Surfaces, Controllers/Joysticks, Virtual Reality Devices, Others), By End-users (Casual Gaming, Professional Gaming) And Competitive Landscape
| Product Code: ETC012543 | Publication Date: Oct 2020 | Updated Date: Jun 2026 | Product Type: Report | |
| Publisher: 6Wresearch | Author: Ravi Bhandari | No. of Pages: 70 | No. of Figures: 35 | No. of Tables: 5 |
Oman Video Game Accessories Market Summary
The oman video game accessories market was estimated at USD 168 Million in 2025 and is projected to reach USD 235 Million by 2032, growing at a CAGR of 5.7% from 2026 to 2032.
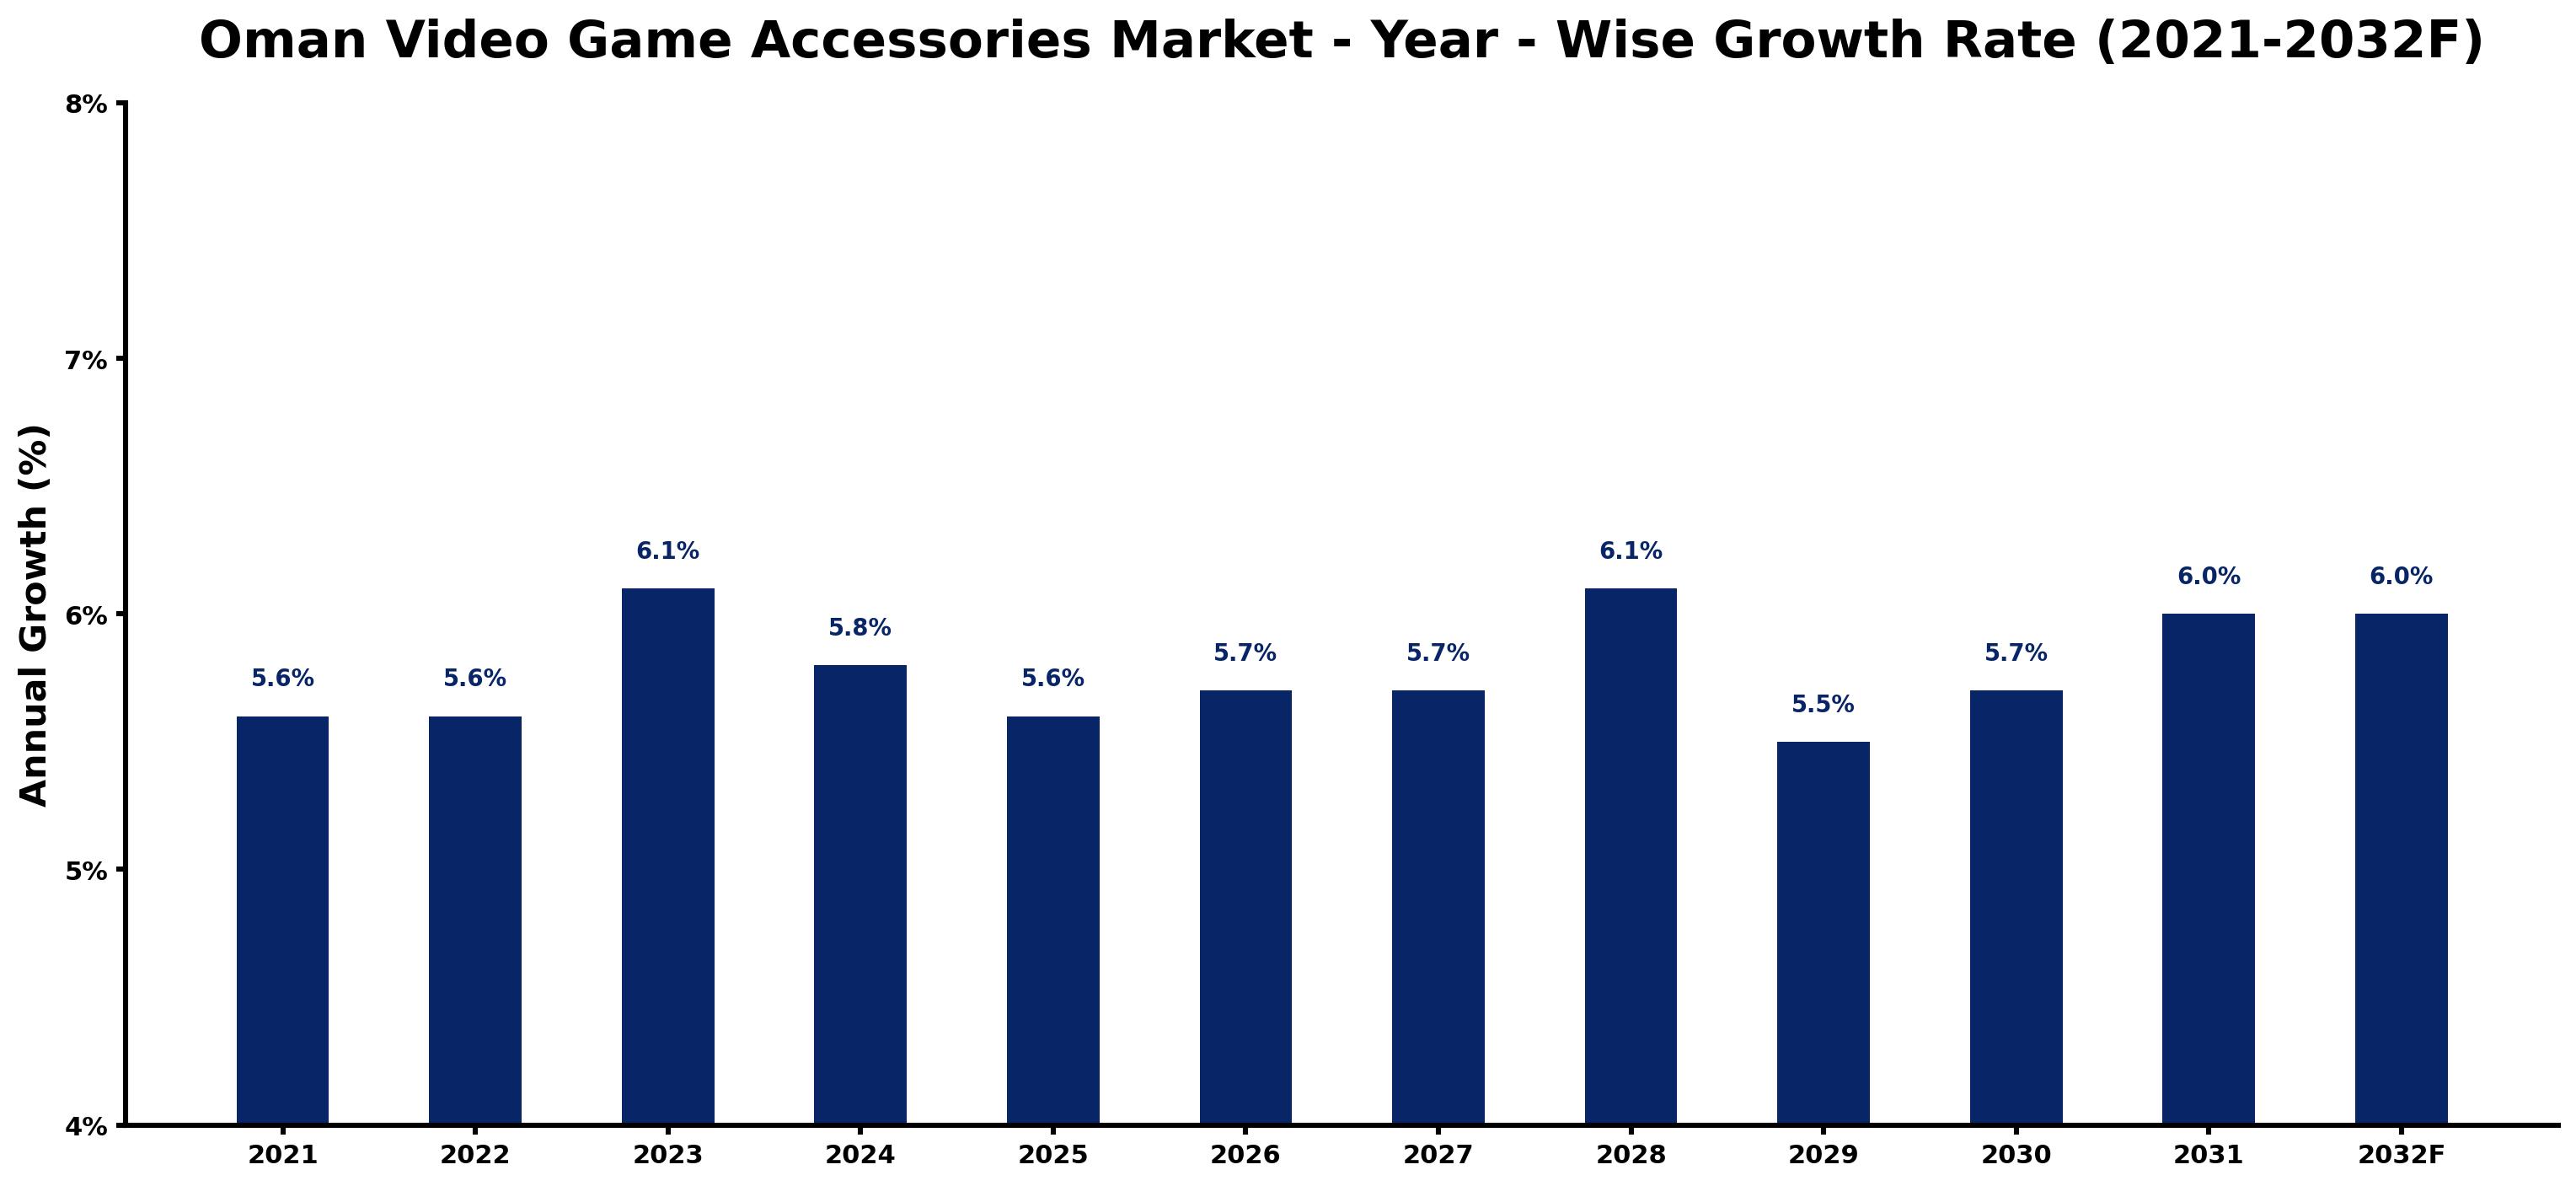
Oman Video Game Accessories Market Growth Rate Analysis (2021-2032)
The Omani video game accessories market has been witnessing steady growth, marked by a 5.6% increase in 2021 and 2022, with a slight uptick to 6.1% in 2023. This growth can be attributed to rising consumer demand, bolstered by increasing disposable income and a burgeoning youth demographic drawn to gaming. Infrastructure improvements and digitalization efforts are enhancing accessibility and engagement, further fueling this expansion. The market is projected to maintain robust growth rates, fluctuating between 5.5% and 6.1% through 2032, as investments in technology and innovative product offerings continue to resonate with gamers in Oman.
Oman Video Game Accessories Market Year-wise Growth Rate and Key Drivers
This graph highlights how the Oman Video Game Accessories Market has steadily grown over the past five years, supported by major growth factors.
The table below presents the year wise growth rates along with the key drivers influencing the market
| Year | Growth Rate | Major Drivers |
| 2021 | 5.6% | Oman experienced a surge in online gaming communities, enhancing accessory sales significantly. |
| 2022 | 5.6% | Esports events captured local attention, driving interest in high-performance gaming peripherals. |
| 2023 | 6.1% | Increased disposable income among youth led to more spending on gaming accessories. |
| 2024 | 5.8% | Local retail channels expanded, providing easier access to global gaming brands. |
| 2025 | 5.6% | Brands began launching region-specific products, catering to local preferences and trends. |
| 2026 | 5.7% | The integration of augmented reality in gaming sparked demand for specialized accessories. |
| 2027 | 5.7% | Partnerships with global gaming companies improved product availability in the market. |
| 2028 | 6.1% | Increased focus on sustainability led brands to develop eco-friendly gaming products. |
| 2029 | 5.5% | Technological advancements in gaming consoles prompted accessory upgrades from consumers. |
| 2030 | 5.7% | Growing interest in mobile gaming created opportunities for portable gaming accessories. |
| 2031 | 6.0% | Social media influencers played a critical role in shaping gaming accessory trends. |
| 2032 | 6.0% | Improved internet infrastructure enabled seamless online gaming experiences, increasing accessory usage. |
Note - Market size estimations and growth projections presented in this report are based on 6Wresearch's advanced forecasting approach, validated with industry datasets as of June 2026.
Key Highlights of the Report:
- Oman Video Game Accessories Market Outlook
- Market Size of Oman Video Game Accessories Market, 2025
- Forecast of Oman Video Game Accessories Market, 2032F
- Historical Data and Forecast of Oman Video Game Accessories Revenues & Volume for the Period 2022-2032F
- Oman Video Game Accessories Market Trend Evolution
- Oman Video Game Accessories Market Drivers and Challenges
- Oman Video Game Accessories Price Trends
- Oman Video Game Accessories Porter's Five Forces
- Oman Video Game Accessories Industry Life Cycle
- Historical Data and Forecast of Oman Video Game Accessories Market Revenues & Volume By Product Type for the Period 2022-2032F
- Historical Data and Forecast of Oman Video Game Accessories Market Revenues & Volume By Gamepads for the Period 2022-2032F
- Historical Data and Forecast of Oman Video Game Accessories Market Revenues & Volume By Keyboards for the Period 2022-2032F
- Historical Data and Forecast of Oman Video Game Accessories Market Revenues & Volume By Mice for the Period 2022-2032F
- Historical Data and Forecast of Oman Video Game Accessories Market Revenues & Volume By Headset for the Period 2022-2032F
- Historical Data and Forecast of Oman Video Game Accessories Market Revenues & Volume By Surfaces for the Period 2022-2032F
- Historical Data and Forecast of Oman Video Game Accessories Market Revenues & Volume By Controllers/Joysticks for the Period 2022-2032F
- Historical Data and Forecast of Oman Video Game Accessories Market Revenues & Volume By Virtual Reality Devices for the Period 2022-2032F
- Historical Data and Forecast of Oman Gamepads Video Game Accessories Market Revenues & Volume By Others for the Period 2022-2032F
- Historical Data and Forecast of Oman Video Game Accessories Market Revenues & Volume By End-users for the Period 2022-2032F
- Historical Data and Forecast of Oman Video Game Accessories Market Revenues & Volume By Casual Gaming? for the Period 2022-2032F
- Historical Data and Forecast of Oman Video Game Accessories Market Revenues & Volume By Professional Gaming for the Period 2022-2032F
- Oman Video Game Accessories Import Export Trade Statistics
- Market Opportunity Assessment By Product Type
- Market Opportunity Assessment By End-users
- Oman Video Game Accessories Top Companies Market Share
- Oman Video Game Accessories Competitive Benchmarking By Technical and Operational Parameters
- Oman Video Game Accessories Company Profiles
- Oman Video Game Accessories Key Strategic Recommendations
Frequently Asked Questions About the Market Study (FAQs):
6Wresearch actively monitors the Oman Video Game Accessories Market and publishes its comprehensive annual report, highlighting emerging trends, growth drivers, revenue analysis, and forecast outlook. Our insights help businesses to make data-backed strategic decisions with ongoing market dynamics. Our analysts track relevent industries related to the Oman Video Game Accessories Market, allowing our clients with actionable intelligence and reliable forecasts tailored to emerging regional needs.
Yes, we provide customisation as per your requirements. To learn more, feel free to contact us on sales@6wresearch.com
1 Executive Summary |
2 Introduction |
2.1 Key Highlights of the Report |
2.2 Report Description |
2.3 Market Scope & Segmentation |
2.4 Research Methodology |
2.5 Assumptions |
3 Oman Video Game Accessories Market Overview |
3.1 Oman Country Macro Economic Indicators |
3.2 Oman Video Game Accessories Market Revenues & Volume, 2022 & 2032F |
3.3 Oman Video Game Accessories Market - Industry Life Cycle |
3.4 Oman Video Game Accessories Market - Porter's Five Forces |
3.5 Oman Video Game Accessories Market Revenues & Volume Share, By Product Type, 2022 & 2032F |
3.6 Oman Video Game Accessories Market Revenues & Volume Share, By End-users, 2022 & 2032F |
4 Oman Video Game Accessories Market Dynamics |
4.1 Impact Analysis |
4.2 Market Drivers |
4.3 Market Restraints |
5 Oman Video Game Accessories Market Trends |
6 Oman Video Game Accessories Market, By Types |
6.1 Oman Video Game Accessories Market, By Product Type |
6.1.1 Overview and Analysis |
6.1.2 Oman Video Game Accessories Market Revenues & Volume, By Product Type, 2022 - 2032F |
6.1.3 Oman Video Game Accessories Market Revenues & Volume, By Gamepads, 2022 - 2032F |
6.1.4 Oman Video Game Accessories Market Revenues & Volume, By Keyboards, 2022 - 2032F |
6.1.5 Oman Video Game Accessories Market Revenues & Volume, By Mice, 2022 - 2032F |
6.1.6 Oman Video Game Accessories Market Revenues & Volume, By Headset, 2022 - 2032F |
6.1.7 Oman Video Game Accessories Market Revenues & Volume, By Surfaces, 2022 - 2032F |
6.1.8 Oman Video Game Accessories Market Revenues & Volume, By Controllers/Joysticks, 2022 - 2032F |
6.1.9 Oman Video Game Accessories Market Revenues & Volume, By Others, 2022 - 2032F |
6.1.10 Oman Video Game Accessories Market Revenues & Volume, By Others, 2022 - 2032F |
6.2 Oman Video Game Accessories Market, By End-users |
6.2.1 Overview and Analysis |
6.2.2 Oman Video Game Accessories Market Revenues & Volume, By Casual Gaming , 2022 - 2032F |
6.2.3 Oman Video Game Accessories Market Revenues & Volume, By Professional Gaming, 2022 - 2032F |
7 Oman Video Game Accessories Market Import-Export Trade Statistics |
7.1 Oman Video Game Accessories Market Export to Major Countries |
7.2 Oman Video Game Accessories Market Imports from Major Countries |
8 Oman Video Game Accessories Market Key Performance Indicators |
9 Oman Video Game Accessories Market - Opportunity Assessment |
9.1 Oman Video Game Accessories Market Opportunity Assessment, By Product Type, 2022 & 2032F |
9.2 Oman Video Game Accessories Market Opportunity Assessment, By End-users, 2022 & 2032F |
10 Oman Video Game Accessories Market - Competitive Landscape |
10.1 Oman Video Game Accessories Market Revenue Share, By Companies, 2025 |
10.2 Oman Video Game Accessories Market Competitive Benchmarking, By Operating and Technical Parameters |
11 Company Profiles |
12 Recommendations |
13 Disclaimer |
Global Go To Market Strategy - 2030
Export potential enables firms to identify high-growth global markets with greater confidence by combining advanced trade intelligence with a structured quantitative methodology. The framework analyzes emerging demand trends and country-level import patterns while integrating macroeconomic and trade datasets such as GDP and population forecasts, bilateral import–export flows, tariff structures, elasticity differentials between developed and developing economies, geographic distance, and import demand projections. Using weighted trade values from 2020–2024 as the base period to project country-to-country export potential for 2030, these inputs are operationalized through calculated drivers such as gravity model parameters, tariff impact factors, and projected GDP per-capita growth. Through an analysis of hidden potentials, demand hotspots, and market conditions that are most favorable to success, this method enables firms to focus on target countries, maximize returns, and global expansion with data, backed by accuracy.
By factoring in the projected importer demand gap that is currently unmet and could be potential opportunity, it identifies the potential for the Exporter (Country) among 190 countries, against the general trade analysis, which identifies the biggest importer or exporter.
To discover high-growth global markets and optimize your business strategy:
Click Here
Pricing
- Single User License$ 1,995
- Department License$ 2,400
- Site License$ 3,120
- Global License$ 3,795

Leadership Perspectives from Industry Events
Search
Thought Leadership and Analyst Meet


Our Clients
6WResearch In News
- India Air Conditioner Market Set for Strong Rebound in 2026 After Weather-Led Correction and GST-Driven Recovery: 6Wresearch
- ADAS in India: How Automatic Emergency Braking, Blind Spot Detection & Driver Monitoring are Transforming Road Safety
- Doha a strategic location for EV manufacturing hub: IPA Qatar
- Demand for luxury TVs surging in the GCC, says Samsung
- Empowering Growth: The Thriving Journey of Bangladesh’s Cable Industry
- Demand for luxury TVs surging in the GCC, says Samsung
Latest Reports
- Poland Fire Protection Systems Market (2026-2032)
- Cape Verde Portable Hand-Thrown Extinguisher Market (2026-2032)
- Canada Portable Hand-Thrown Extinguisher Market (2026-2032)
- Cameroon Portable Hand-Thrown Extinguisher Market (2026-2032)
- Burundi Portable Hand-Thrown Extinguisher Market (2026-2032)
- Burkina Faso Portable Hand-Thrown Extinguisher Market (2026-2032)
- Bulgaria Portable Hand-Thrown Extinguisher Market (2026-2032)
- Brunei Portable Hand-Thrown Extinguisher Market (2026-2032)
- Botswana Portable Hand-Thrown Extinguisher Market (2026-2032)
- Bosnia and Herzegovina Portable Hand-Thrown Extinguisher Market (2026-2032)
Industry Events and Analyst Meet

HIMTEX 2026

India Refining Summit 2026

India EV Show 2026

EV tech India Expo 2026

Auto Tech Asia 2026
Whitepaper
- Middle East & Africa Commercial Security Market Click here to view more.
- Middle East & Africa Fire Safety Systems & Equipment Market Click here to view more.
- GCC Drone Market Click here to view more.
- Middle East Lighting Fixture Market Click here to view more.
- GCC Physical & Perimeter Security Market Click here to view more.