Philippines Non-grape Wine Market (2026-2032) | Revenue, Trends, Outlook, Size, Share, Growth, Forecast, Companies, Analysis, Value & Industry
Market Forecast By Product Type (Fermented Fruit Wine, Distilled Fruit Wine, Preparation Fruit Wine, Sparkling Fruit Wine), By Application (Household, Commercial) And Competitive Landscape
| Product Code: ETC031309 | Publication Date: Jul 2023 | Updated Date: Jun 2026 | Product Type: Report | |
| Publisher: 6Wresearch | Author: Ravi Bhandari | No. of Pages: 70 | No. of Figures: 35 | No. of Tables: 5 |
Philippines Non-grape Wine Market Summary
The philippines non-grape wine market was estimated at USD 237 Million in 2025 and is projected to reach USD 334 Million by 2032, growing at a CAGR of 6.2% from 2026 to 2032.
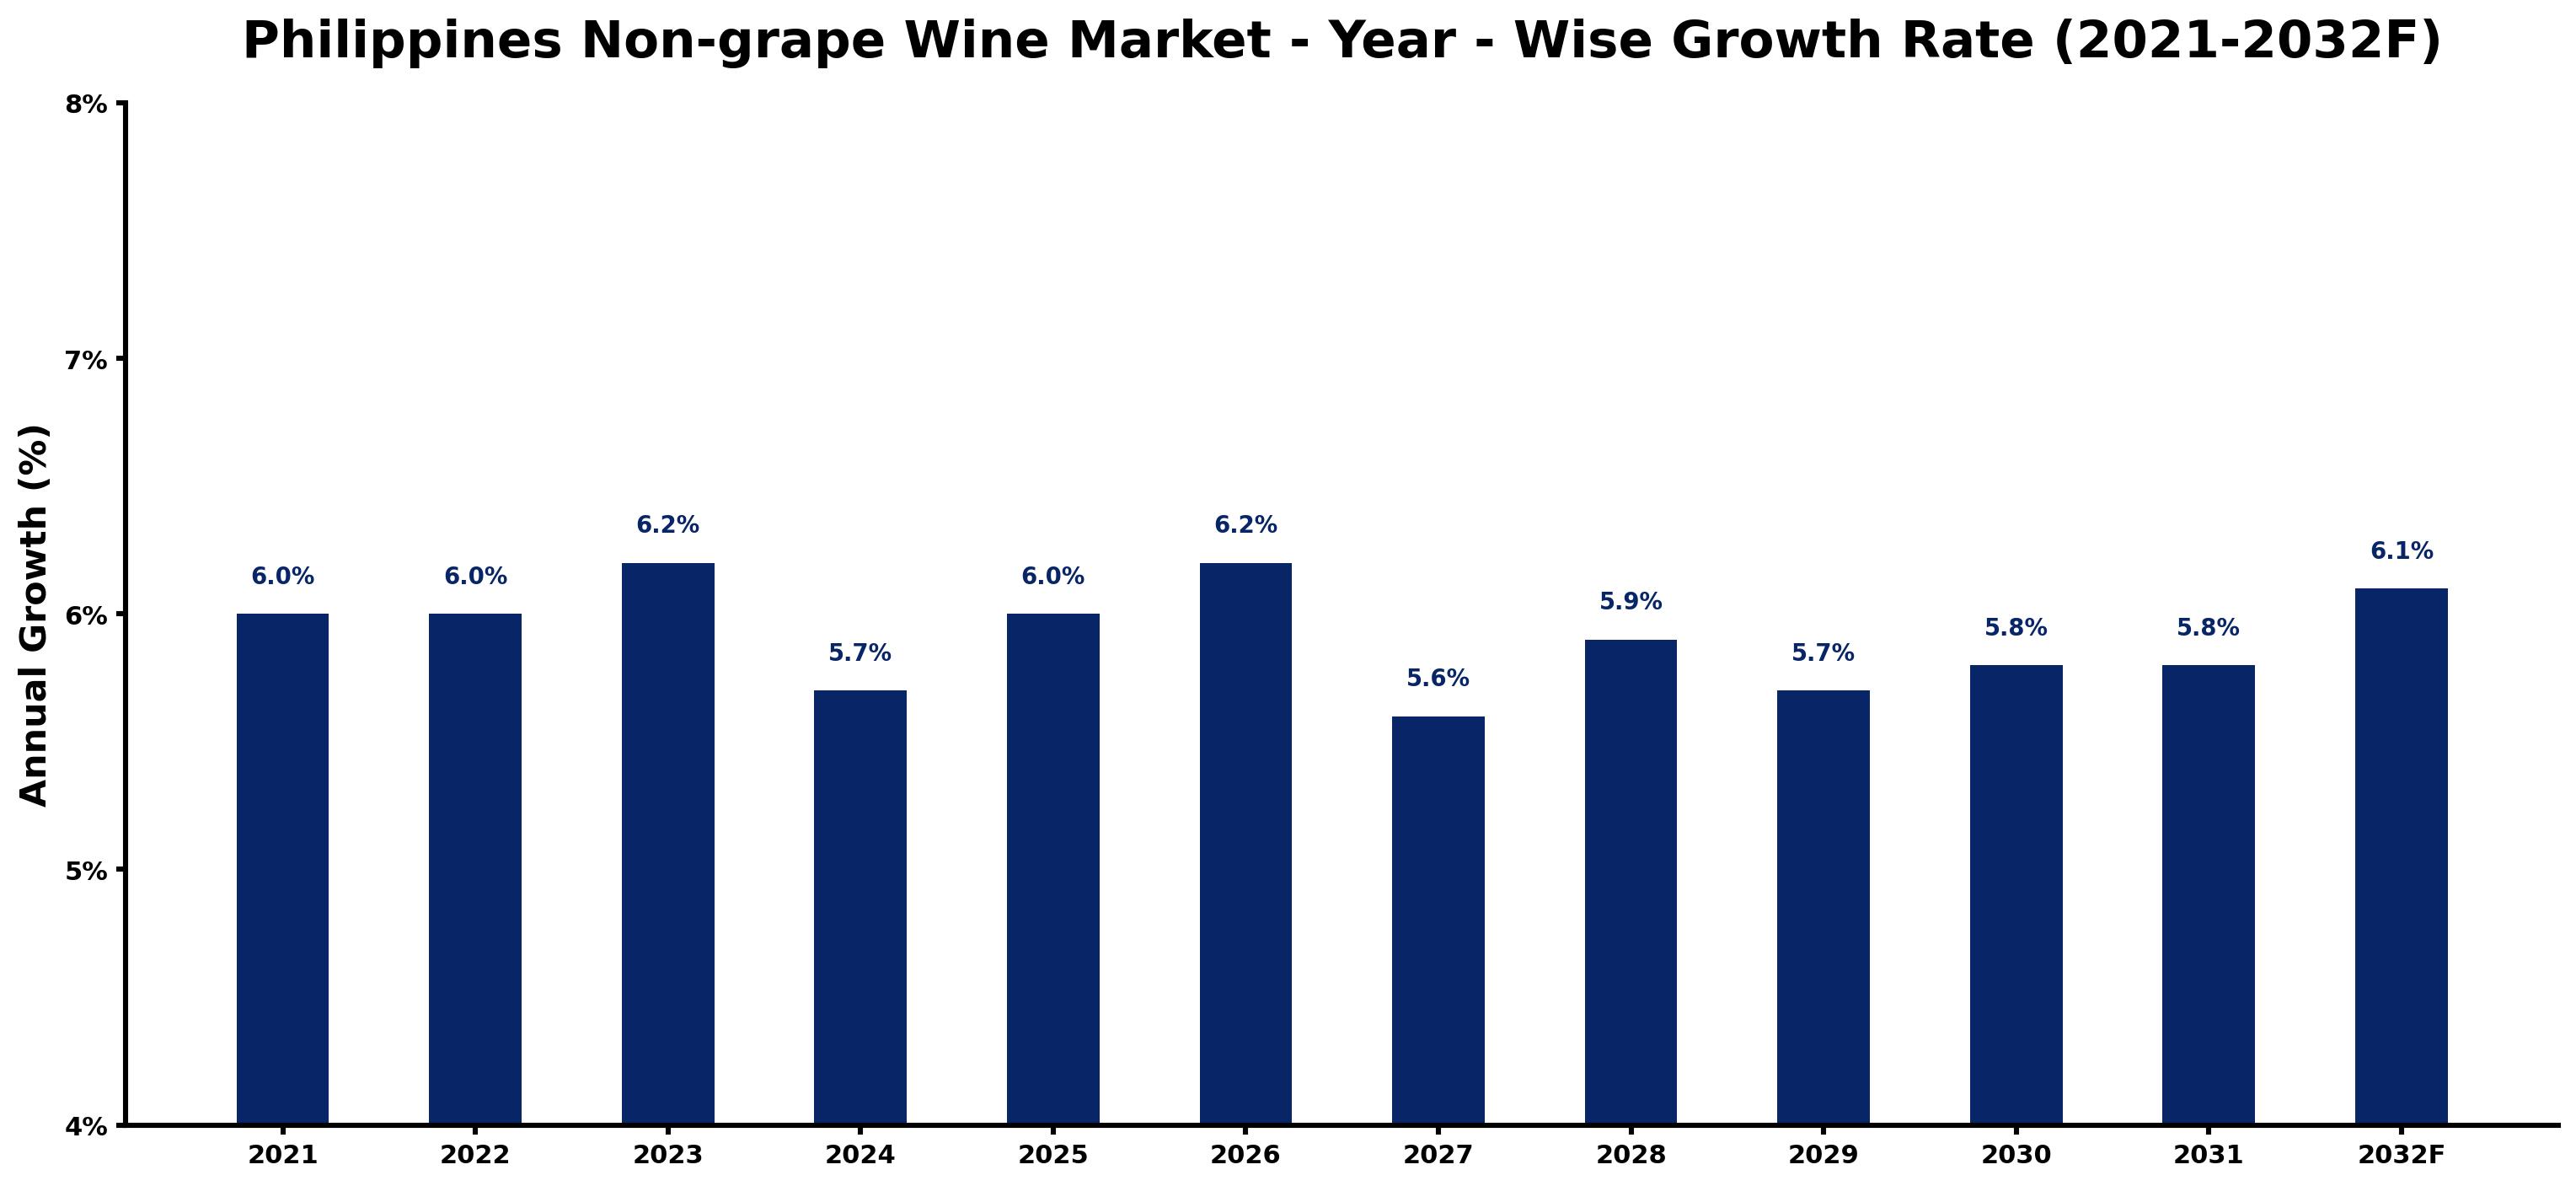
Philippines Non-grape Wine Market Growth Rate Analysis (2021-2032)
The Philippines' non-grape wine market is experiencing stable expansion, with growth rates of 6.0% in both 2021 and 2022, gradually increasing to 6.2% in 2023. Factors driving this upward trend include a burgeoning middle class, growing consumer interest in unique beverage experiences, and increased investments in local production techniques. Although there is a slight dip predicted for 2024 at 5.7%, the market is expected to regain momentum, with growth rates around 6.0% and 6.2% from 2025 to 2026. The ongoing digitalization of retail and rising awareness of non-grape wine varieties are also significant contributors to sustained consumer demand through 2032, ensuring a steady market climate.
Philippines Non-grape Wine Market Year-wise Growth Rate and Key Drivers
This graph highlights how the Philippines Non-grape Wine Market has steadily grown over the past five years, supported by major growth factors.
The table below presents the year wise growth rates along with the key drivers influencing the market
| Year | Growth Rate | Major Drivers |
| 2021 | 6.0% | Heightened interest in alternative beverages fueled exploration of non-grape wines. |
| 2022 | 6.0% | Local vineyards began producing unique non-grape wines, captivating consumer attention. |
| 2023 | 6.2% | Diverse flavors from local fruit varieties attracted adventurous wine enthusiasts. |
| 2024 | 5.7% | E-commerce platforms expanded access to niche wine markets across the Philippines. |
| 2025 | 6.0% | Cultural events celebrating local wine traditions gained popularity among consumers. |
| 2026 | 6.2% | Increased awareness of health benefits related to moderate wine consumption influenced preferences. |
| 2027 | 5.6% | Social media campaigns showcased local non-grape wines, boosting brand visibility and sales. |
| 2028 | 5.9% | Collaborations between chefs and winemakers enhanced dining experiences with innovative pairings. |
| 2029 | 5.7% | International wine competitions recognized Philippine non-grape wines, elevating global reputation. |
| 2030 | 5.8% | Sustainable farming practices in vineyards attracted environmentally conscious consumers seeking alternatives. |
| 2031 | 5.8% | Growing tourism in wine regions encouraged local tastings and wine tourism ventures. |
| 2032 | 6.1% | Investment in wine education programs cultivated a knowledgeable consumer base passionate about non-grape wines. |
Note - Market size estimations and growth projections presented in this report are based on 6Wresearch's advanced forecasting approach, validated with industry datasets as of June 2026.
Philippines Non-grape Wine Market Synopsis
The Philippines Non-grape Wine Market is projected to reach 6.2% and witness significant growth during the forecast period (2026-2032). Non-grape wines, made from fruits such as apples, oranges, and pears, present a growing alternative to traditional grape-based wine. The appeal lies in their unique flavor profiles, lower alcoholic content, and increasing health consciousness among Filipino consumers.
Philippines Non-grape Wine Market Growth Drivers
The driving forces behind the expansion of the Philippines Non-grape Wine Market are multifaceted. Firstly, there is a marked increase in consumer awareness regarding health and wellness, encouraging individuals to seek out low-calorie alternatives. This trend aligns with the rising preference for non-grape beverages, which are perceived as healthier without sacrificing enjoyment during social gatherings. Secondly, the growth of disposable income among Filipinos has facilitated the exploration of premium beverage options, allowing consumers to indulge in higher-quality non-grape wines that offer distinctive taste experiences.
- Health-conscious consumers are actively seeking beverages with lower calorie counts, leading to heightened interest in non-grape wines.
- The rising middle class in the Philippines is more willing to invest in premium alternatives, thus driving the market for non-grape wines.
- The diversity of flavor profiles found in non-grape wines attracts those looking for unique drinking experiences beyond conventional options.
- Increased marketing efforts and product availability have made non-grape wines more visible and accessible to a broader audience.
- Social media platforms have played a pivotal role in promoting non-grape wines, enhancing consumer awareness and engagement.
Philippines Non-grape Wine Market Challenges and Restraints
While the market demonstrates promising growth, it also faces several challenges. A significant concern is the high production costs associated with non-grape wine manufacturing. The processes involved, including multiple fermentation stages, necessitate substantial investment in equipment, materials, and skilled labor. These high costs can lead to reduced profitability margins for producers, thereby influencing pricing strategies in the market.
- The complexity of the production process requires advanced technology, which may not be affordable for smaller producers.
- Strict regulations and standards in food and beverage production can hinder smaller entrants from competing effectively.
- Market saturation with various alcoholic alternatives, including spirits and traditional wines, can dilute consumer focus on non-grape offerings.
- Consumer preference volatility may pose risks, as trends in beverage consumption can shift rapidly.
- Maintaining quality and authenticity while scaling production can become a challenge for providers in the market.
Philippines Non-grape Wine Market Government Investment and Initiatives
The Philippine government has recognized the potential of the beverage sector, offering various initiatives and investments aimed at stimulating the non-grape wine industry. Policies are being developed to encourage local production, including support for agricultural sectors that produce the requisite fruits. In addition, public spending on research and development can promote innovative production methods, ultimately enhancing product quality and environmental sustainability. Furthermore, initiatives designed to bolster the export potential of non-grape wines can aid local producers in accessing international markets, thereby expanding their reach beyond domestic consumers.
Philippines Non-grape Wine Market Latest Developments (May 2025 - June 2026)
Recent developments in the Philippines Non-grape Wine Market indicate an increasing trend toward diversification and innovation. Many producers are experimenting with novel fruit combinations and flavor infusions, which are catering to evolving consumer tastes. Additionally, market players are investing in branding and packaging enhancements to differentiate their products in a competitive landscape. There has also been a notable emphasis on sustainable practices, as companies strive to reduce their environmental footprint through eco-friendly packaging solutions. As consumer preferences continue to evolve, the market is likely to witness further product innovations and strategic partnerships aimed at bolstering market presence.
Philippines Non-grape Wine Market - Key Attractiveness of the Report
- 10 Years of Market Numbers
- Historical Data Starting from 2022 to 2025
- Base Year: 2025
- Forecast Data until 2032
- Key Performance Indicators Impacting the Market
- Major Upcoming Developments and Projects
Key Highlights of the Report:
- Philippines Non-grape Wine Market Outlook
- Market Size of Philippines Non-grape Wine Market, 2025
- Forecast of Philippines Non-grape Wine Market, 2032
- Historical Data and Forecast of Philippines Non-grape Wine Revenues & Volume for the Period 2022-2032F
- Philippines Non-grape Wine Market Trend Evolution
- Philippines Non-grape Wine Market Drivers and Challenges
- Philippines Non-grape Wine Price Trends
- Philippines Non-grape Wine Porter's Five Forces
- Philippines Non-grape Wine Industry Life Cycle
- Historical Data and Forecast of Philippines Non-grape Wine Market Revenues & Volume By Product Type for the Period 2022-2032F
- Historical Data and Forecast of Philippines Non-grape Wine Market Revenues & Volume By Fermented Fruit Wine for the Period 2022-2032F
- Historical Data and Forecast of Philippines Non-grape Wine Market Revenues & Volume By Distilled Fruit Wine for the Period 2022-2032F
- Historical Data and Forecast of Philippines Non-grape Wine Market Revenues & Volume By Preparation Fruit Wine for the Period 2022-2032F
- Historical Data and Forecast of Philippines Non-grape Wine Market Revenues & Volume By Sparkling Fruit Wine for the Period 2022-2032F
- Historical Data and Forecast of Philippines Non-grape Wine Market Revenues & Volume By Application for the Period 2022-2032F
- Historical Data and Forecast of Philippines Non-grape Wine Market Revenues & Volume By Household for the Period 2022-2032F
- Historical Data and Forecast of Philippines Non-grape Wine Market Revenues & Volume By Commercial for the Period 2022-2032F
- Philippines Non-grape Wine Import Export Trade Statistics
- Market Opportunity Assessment By Product Type
- Market Opportunity Assessment By Application
- Philippines Non-grape Wine Top Companies Market Share
- Philippines Non-grape Wine Competitive Benchmarking By Technical and Operational Parameters
- Philippines Non-grape Wine Company Profiles
- Philippines Non-grape Wine Key Strategic Recommendations
Frequently Asked Questions About the Market Study (FAQs):
Non-grape wines are primarily crafted from a variety of fruits such as apples, pears, and citrus fruits, each contributing unique flavor profiles that differentiate them from traditional grape wines.
Generally, non-grape wines tend to be priced lower than traditional grape wines, making them an attractive option for budget-conscious consumers.
Key factors include increased health consciousness, rising disposable incomes, and a growing demand for unique beverage experiences among Filipino consumers.
Non-grape wines typically have lower alcohol content and fewer calories than traditional wines, appealing to consumers who prioritize health and wellness in their beverage choices.
6Wresearch actively monitors the Philippines Non-grape Wine Market and publishes its comprehensive annual report, highlighting emerging trends, growth drivers, revenue analysis, and forecast outlook. Our insights help businesses to make data-backed strategic decisions with ongoing market dynamics. Our analysts track relevent industries related to the Philippines Non-grape Wine Market, allowing our clients with actionable intelligence and reliable forecasts tailored to emerging regional needs.
Yes, we provide customisation as per your requirements. To learn more, feel free to contact us on sales@6wresearch.com
1 Executive Summary |
2 Introduction |
2.1 Key Highlights of the Report |
2.2 Report Description |
2.3 Market Scope & Segmentation |
2.4 Research Methodology |
2.5 Assumptions |
3 Philippines Non-grape Wine Market Overview |
3.1 Philippines Country Macro Economic Indicators |
3.2 Philippines Non-grape Wine Market Revenues & Volume, 2022 & 2032F |
3.3 Philippines Non-grape Wine Market - Industry Life Cycle |
3.4 Philippines Non-grape Wine Market - Porter's Five Forces |
3.5 Philippines Non-grape Wine Market Revenues & Volume Share, By Product Type, 2022 & 2032F |
3.6 Philippines Non-grape Wine Market Revenues & Volume Share, By Application, 2022 & 2032F |
4 Philippines Non-grape Wine Market Dynamics |
4.1 Impact Analysis |
4.2 Market Drivers |
4.2.1 Increasing consumer awareness about health benefits of non-grape wines |
4.2.2 Growing popularity of Filipino cuisine and interest in local products |
4.2.3 Rise in disposable income leading to higher spending on premium beverages |
4.3 Market Restraints |
4.3.1 Limited distribution channels for non-grape wines in the Philippines |
4.3.2 High import taxes and duties on raw materials for non-grape wine production |
5 Philippines Non-grape Wine Market Trends |
6 Philippines Non-grape Wine Market, By Types |
6.1 Philippines Non-grape Wine Market, By Product Type |
6.1.1 Overview and Analysis |
6.1.2 Philippines Non-grape Wine Market Revenues & Volume, By Product Type, 2022-2032F |
6.1.3 Philippines Non-grape Wine Market Revenues & Volume, By Fermented Fruit Wine, 2022-2032F |
6.1.4 Philippines Non-grape Wine Market Revenues & Volume, By Distilled Fruit Wine, 2022-2032F |
6.1.5 Philippines Non-grape Wine Market Revenues & Volume, By Preparation Fruit Wine, 2022-2032F |
6.1.6 Philippines Non-grape Wine Market Revenues & Volume, By Sparkling Fruit Wine, 2022-2032F |
6.2 Philippines Non-grape Wine Market, By Application |
6.2.1 Overview and Analysis |
6.2.2 Philippines Non-grape Wine Market Revenues & Volume, By Household, 2022-2032F |
6.2.3 Philippines Non-grape Wine Market Revenues & Volume, By Commercial, 2022-2032F |
7 Philippines Non-grape Wine Market Import-Export Trade Statistics |
7.1 Philippines Non-grape Wine Market Export to Major Countries |
7.2 Philippines Non-grape Wine Market Imports from Major Countries |
8 Philippines Non-grape Wine Market Key Performance Indicators |
8.1 Percentage increase in the number of Filipino restaurants offering non-grape wines on their menu |
8.2 Growth in the number of local wineries producing non-grape wines |
8.3 Increase in the average price per bottle of non-grape wines sold in the Philippines |
8.4 Number of promotional events or collaborations featuring non-grape wines in the market |
8.5 Percentage of consumers who consider non-grape wines as a preferred choice for social gatherings and celebrations |
9 Philippines Non-grape Wine Market - Opportunity Assessment |
9.1 Philippines Non-grape Wine Market Opportunity Assessment, By Product Type, 2022 & 2032F |
9.2 Philippines Non-grape Wine Market Opportunity Assessment, By Application, 2022 & 2032F |
10 Philippines Non-grape Wine Market - Competitive Landscape |
10.1 Philippines Non-grape Wine Market Revenue Share, By Companies, 2025 |
10.2 Philippines Non-grape Wine Market Competitive Benchmarking, By Operating and Technical Parameters |
11 Company Profiles |
12 Recommendations |
13 Disclaimer |
Global Go To Market Strategy - 2030
Export potential enables firms to identify high-growth global markets with greater confidence by combining advanced trade intelligence with a structured quantitative methodology. The framework analyzes emerging demand trends and country-level import patterns while integrating macroeconomic and trade datasets such as GDP and population forecasts, bilateral import–export flows, tariff structures, elasticity differentials between developed and developing economies, geographic distance, and import demand projections. Using weighted trade values from 2020–2024 as the base period to project country-to-country export potential for 2030, these inputs are operationalized through calculated drivers such as gravity model parameters, tariff impact factors, and projected GDP per-capita growth. Through an analysis of hidden potentials, demand hotspots, and market conditions that are most favorable to success, this method enables firms to focus on target countries, maximize returns, and global expansion with data, backed by accuracy.
By factoring in the projected importer demand gap that is currently unmet and could be potential opportunity, it identifies the potential for the Exporter (Country) among 190 countries, against the general trade analysis, which identifies the biggest importer or exporter.
To discover high-growth global markets and optimize your business strategy:
Click Here
Pricing
- Single User License$ 1,995
- Department License$ 2,400
- Site License$ 3,120
- Global License$ 3,795

Leadership Perspectives from Industry Events
Search
Thought Leadership and Analyst Meet


Our Clients
6WResearch In News
- India Air Conditioner Market Set for Strong Rebound in 2026 After Weather-Led Correction and GST-Driven Recovery: 6Wresearch
- ADAS in India: How Automatic Emergency Braking, Blind Spot Detection & Driver Monitoring are Transforming Road Safety
- Doha a strategic location for EV manufacturing hub: IPA Qatar
- Demand for luxury TVs surging in the GCC, says Samsung
- Empowering Growth: The Thriving Journey of Bangladesh’s Cable Industry
- Demand for luxury TVs surging in the GCC, says Samsung
Latest Reports
- Poland Fire Protection Systems Market (2026-2032)
- Cape Verde Portable Hand-Thrown Extinguisher Market (2026-2032)
- Canada Portable Hand-Thrown Extinguisher Market (2026-2032)
- Cameroon Portable Hand-Thrown Extinguisher Market (2026-2032)
- Burundi Portable Hand-Thrown Extinguisher Market (2026-2032)
- Burkina Faso Portable Hand-Thrown Extinguisher Market (2026-2032)
- Bulgaria Portable Hand-Thrown Extinguisher Market (2026-2032)
- Brunei Portable Hand-Thrown Extinguisher Market (2026-2032)
- Botswana Portable Hand-Thrown Extinguisher Market (2026-2032)
- Bosnia and Herzegovina Portable Hand-Thrown Extinguisher Market (2026-2032)
Industry Events and Analyst Meet

HIMTEX 2026

India Refining Summit 2026

India EV Show 2026

EV tech India Expo 2026

Auto Tech Asia 2026
Whitepaper
- Middle East & Africa Commercial Security Market Click here to view more.
- Middle East & Africa Fire Safety Systems & Equipment Market Click here to view more.
- GCC Drone Market Click here to view more.
- Middle East Lighting Fixture Market Click here to view more.
- GCC Physical & Perimeter Security Market Click here to view more.