Qatar Fish Processing Market (2026-2032) | Trends, Outlook, Industry, Forecast, Companies, Value, Size, Share, Growth, Revenue & Analysis
Market Forecast By Source (Marine, Inland, Freshwater), By Application (Food, Feed, Biomedical, Others), By Processing (Frozen, Preserved, Others), By Equipment (Gutting, Scaling, Filleting, Deboning, Skinning, Curing & Smoking, Others) And Competitive Landscape
| Product Code: ETC042621 | Publication Date: Jul 2023 | Updated Date: Jun 2026 | Product Type: Report | |
| Publisher: 6Wresearch | Author: Ravi Bhandari | No. of Pages: 70 | No. of Figures: 35 | No. of Tables: 5 |
Qatar Fish Processing Market Summary
The qatar fish processing market was estimated at USD 455 Million in 2025 and is projected to reach USD 625 Million by 2032, growing at a CAGR of 5.3% from 2026 to 2032.
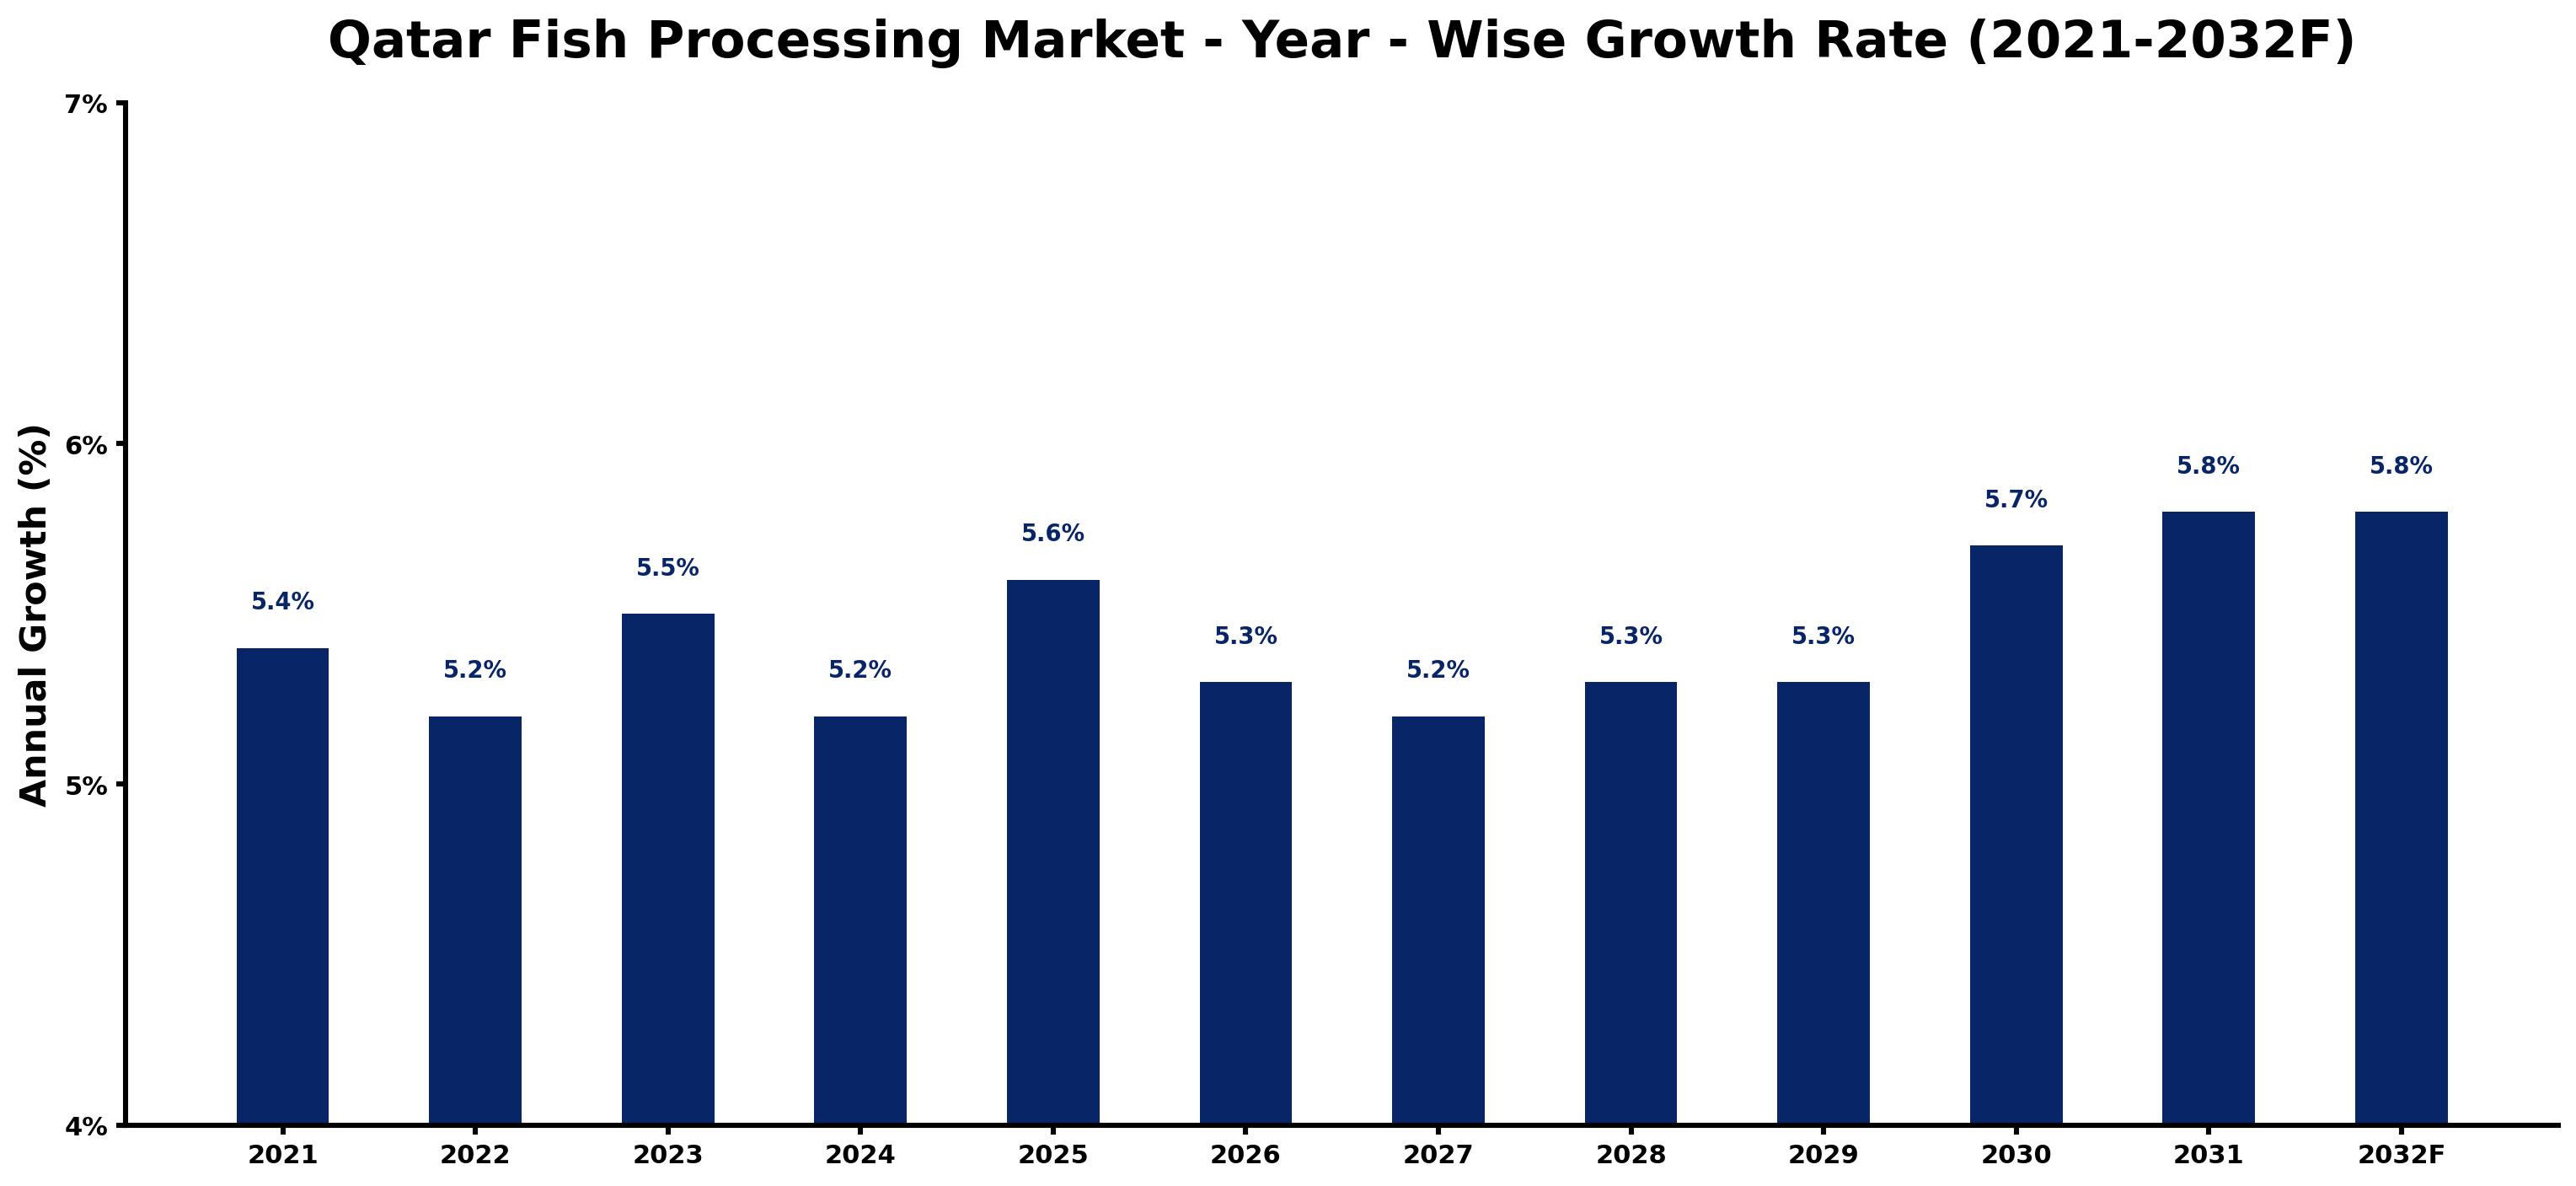
Qatar Fish Processing Market Growth Rate Analysis (2021-2032)
The Qatar fish processing market has exhibited stable growth, marked by an annual increase of 5.4% in 2021, followed by a slight dip to 5.2% in 2022. However, this trend rebounded in 2023 with a growth rate of 5.5%, indicating a resurgence in consumer demand bolstered by rising health awareness and dietary shifts towards seafood. The growth is projected to sustain at around 5.2% to 5.6% from 2024 through 2028, buoyed by investments in processing technologies and infrastructure improvements. By 2030, the market is anticipated to experience its peak growth rate of 5.8%, driven by increasing domestic consumption and export opportunities within the region, making it a focal point for future investments.
Qatar Fish Processing Market Year-wise Growth Rate and Key Drivers
This graph highlights how the Qatar Fish Processing Market has steadily grown over the past five years, supported by major growth factors.
The table below presents the year wise growth rates along with the key drivers influencing the market
| Year | Growth Rate | Major Drivers |
| 2021 | 5.4% | Post-lockdown retail projects catalyze fresh fish demand across urban areas. |
| 2022 | 5.2% | Local culinary trends highlight the popularity of sustainable seafood options in restaurants. |
| 2023 | 5.5% | Increasing tourism flows boost consumption of premium seafood products and dishes. |
| 2024 | 5.2% | New processing technologies enhance efficiency, improving product quality and shelf life. |
| 2025 | 5.6% | Regional supply chain developments reduce dependency on imported fish products significantly. |
| 2026 | 5.3% | Consumer preferences shift towards health-conscious choices, fueling seafood market dynamics. |
| 2027 | 5.2% | Collaboration with international brands introduces innovative processing methods to the market. |
| 2028 | 5.3% | Expansion of export capabilities strengthens Qatar's position in the GCC seafood sector. |
| 2029 | 5.3% | Investment in aquaculture initiatives leads to greater local fish production and sustainability. |
| 2030 | 5.7% | Emerging online platforms facilitate direct consumer access to fish product purchases. |
| 2031 | 5.8% | Increased awareness of food safety standards drives demand for certified processing facilities. |
| 2032 | 5.8% | The construction of new logistics hubs enhances distribution efficiencies across the region. |
Note - Market size estimations and growth projections presented in this report are based on 6Wresearch's advanced forecasting approach, validated with industry datasets as of June 2026.
Qatar Fish Processing Market Synopsis
The Qatar Fish Processing Market is projected to reach 5.3% and witness significant growth during the forecast period (2026-2032). This market encompasses the preparation, preservation, and packaging of fish and seafood products intended for both domestic consumption and export. Qatar's strategic location near the sea, coupled with its ambition to diversify its economy, plays a crucial role in driving the growth of the fish processing sector.
Qatar Fish Processing Market Growth Drivers
The expansion of the Qatar Fish Processing Market can be attributed to several key factors:
- Population growth in Qatar has directly increased the demand for seafood, leading to a higher consumption rate of processed fish products.
- Urbanization trends are further fueling this demand as more individuals transition to urban living, often opting for convenient and packaged food solutions.
- Rising disposable incomes among the local population have made seafood products more accessible, allowing a broader consumer base to enjoy these offerings.
- The Qatari government's initiatives to bolster local fisheries aim to enhance self-sufficiency in food production, particularly in fish products, thus stimulating market growth.
- Investments in modern and efficient fish processing facilities are being prioritized to reduce dependency on imported fish and improve local capabilities.
Qatar Fish Processing Market Challenges and Restraints
Despite the positive outlook for the Qatar Fish Processing Market, several challenges persist:
- Qatar's limited fishery resources pose a significant concern, as the coastal waters have modest fishery potential, necessitating reliance on imports to satisfy demand.
- This dependency on imported fish and seafood creates vulnerabilities in the supply chain, which can be exacerbated during global disruptions.
- Environmental concerns regarding overfishing in nearby international waters can also impact the availability of seafood products.
- Ensuring food safety and hygiene in processing facilities remains a critical challenge, especially in a market that emphasizes quality.
- Lastly, the volatility of global fish prices can affect profitability for processing companies operating within Qatar.
Qatar Fish Processing Market Government Investment and Initiatives
The Qatari government is actively working to enhance the capabilities of the fish processing sector. Several key initiatives aimed at stimulating growth include:
- Investments in infrastructure development for fish processing facilities, including modernizing existing plants to improve efficiency and output.
- Public spending on research and development to innovate fish processing techniques and enhance product quality.
- Support for local fisheries through subsidies and financial incentives that encourage sustainable fishing practices and boost domestic production.
- Strategic partnerships with international organizations to implement best practices in food safety and hygiene within the industry.
- Promotion of educational programs focused on fish processing skills to ensure a skilled workforce capable of supporting the growing market.
Qatar Fish Processing Market Latest Developments (May 2025 - June 2026)
In the period from May 2025 to June 2026, the Qatar Fish Processing Market has seen several noteworthy developments:
- Increased focus on sustainability initiatives has led to a more significant emphasis on environmentally friendly practices in fish processing.
- Technological advancements have been adopted to enhance processing capabilities and improve product quality.
- Collaborations between local processors and international experts have accelerated knowledge transfer and best practice adoption in the industry.
- A rise in consumer awareness regarding food safety has prompted companies to enhance transparency and hygiene standards in their operations.
- Government incentives have further encouraged the establishment of new processing facilities to meet the growing local and export demand.
Qatar Fish Processing Market - Key Attractiveness of the Report
- 10 Years of Market Numbers
- Historical Data Starting from 2022 to 2025
- Base Year: 2025
- Forecast Data until 2032
- Key Performance Indicators Impacting the Market
- Major Upcoming Developments and Projects
Key Highlights of the Report:
- Qatar Fish Processing Market Outlook
- Market Size of Qatar Fish Processing Market, 2025
- Forecast of Qatar Fish Processing Market, 2032
- Historical Data and Forecast of Qatar Fish Processing Revenues & Volume for the Period 2022-2032F
- Qatar Fish Processing Market Trend Evolution
- Qatar Fish Processing Market Drivers and Challenges
- Qatar Fish Processing Price Trends
- Qatar Fish Processing Porter's Five Forces
- Qatar Fish Processing Industry Life Cycle
- Historical Data and Forecast of Qatar Fish Processing Market Revenues & Volume By Source for the Period 2022-2032F
- Historical Data and Forecast of Qatar Fish Processing Market Revenues & Volume By Marine for the Period 2022-2032F
- Historical Data and Forecast of Qatar Fish Processing Market Revenues & Volume By Inland for the Period 2022-2032F
- Historical Data and Forecast of Qatar Fish Processing Market Revenues & Volume By Freshwater for the Period 2022-2032F
- Historical Data and Forecast of Qatar Fish Processing Market Revenues & Volume By Application for the Period 2022-2032F
- Historical Data and Forecast of Qatar Fish Processing Market Revenues & Volume By Food for the Period 2022-2032F
- Historical Data and Forecast of Qatar Fish Processing Market Revenues & Volume By Feed for the Period 2022-2032F
- Historical Data and Forecast of Qatar Fish Processing Market Revenues & Volume By Biomedical for the Period 2022-2032F
- Historical Data and Forecast of Qatar Fish Processing Market Revenues & Volume By Others for the Period 2022-2032F
- Historical Data and Forecast of Qatar Fish Processing Market Revenues & Volume By Processing for the Period 2022-2032F
- Historical Data and Forecast of Qatar Fish Processing Market Revenues & Volume By Frozen for the Period 2022-2032F
- Historical Data and Forecast of Qatar Fish Processing Market Revenues & Volume By Preserved for the Period 2022-2032F
- Historical Data and Forecast of Qatar Fish Processing Market Revenues & Volume By Others for the Period 2022-2032F
- Historical Data and Forecast of Qatar Fish Processing Market Revenues & Volume By Equipment for the Period 2022-2032F
- Historical Data and Forecast of Qatar Fish Processing Market Revenues & Volume By Gutting for the Period 2022-2032F
- Historical Data and Forecast of Qatar Fish Processing Market Revenues & Volume By Scaling for the Period 2022-2032F
- Historical Data and Forecast of Qatar Fish Processing Market Revenues & Volume By Filleting for the Period 2022-2032F
- Historical Data and Forecast of Qatar Fish Processing Market Revenues & Volume By Deboning for the Period 2022-2032F
- Historical Data and Forecast of Qatar Fish Processing Market Revenues & Volume By Skinning for the Period 2022-2032F
- Historical Data and Forecast of Qatar Fish Processing Market Revenues & Volume By Curing & Smoking for the Period 2022-2032F
- Historical Data and Forecast of Qatar Fish Processing Market Revenues & Volume By Others for the Period 2022-2032F
- Qatar Fish Processing Import Export Trade Statistics
- Market Opportunity Assessment By Source
- Market Opportunity Assessment By Application
- Market Opportunity Assessment By Processing
- Market Opportunity Assessment By Equipment
- Qatar Fish Processing Top Companies Market Share
- Qatar Fish Processing Competitive Benchmarking By Technical and Operational Parameters
- Qatar Fish Processing Company Profiles
- Qatar Fish Processing Key Strategic Recommendations
Frequently Asked Questions About the Market Study (FAQs):
The growth of the Qatar Fish Processing Market is primarily driven by population growth, urbanization, rising disposable incomes, and government initiatives aimed at enhancing local fisheries.
The main challenges include limited local fishery resources leading to heavy reliance on imports, supply chain vulnerabilities, and ensuring food safety and hygiene in processing facilities.
The government is investing in infrastructure, providing subsidies, promoting research and development, and facilitating educational programs to enhance skills within the industry.
Recent trends include a focus on sustainability, advancements in processing technology, increased consumer awareness regarding food safety, and greater transparency in operations.
6Wresearch actively monitors the Qatar Fish Processing Market and publishes its comprehensive annual report, highlighting emerging trends, growth drivers, revenue analysis, and forecast outlook. Our insights help businesses to make data-backed strategic decisions with ongoing market dynamics. Our analysts track relevent industries related to the Qatar Fish Processing Market, allowing our clients with actionable intelligence and reliable forecasts tailored to emerging regional needs.
Yes, we provide customisation as per your requirements. To learn more, feel free to contact us on sales@6wresearch.com
1 Executive Summary |
2 Introduction |
2.1 Key Highlights of the Report |
2.2 Report Description |
2.3 Market Scope & Segmentation |
2.4 Research Methodology |
2.5 Assumptions |
3 Qatar Fish Processing Market Overview |
3.1 Qatar Country Macro Economic Indicators |
3.2 Qatar Fish Processing Market Revenues & Volume, 2022 & 2032F |
3.3 Qatar Fish Processing Market - Industry Life Cycle |
3.4 Qatar Fish Processing Market - Porter's Five Forces |
3.5 Qatar Fish Processing Market Revenues & Volume Share, By Source, 2022 & 2032F |
3.6 Qatar Fish Processing Market Revenues & Volume Share, By Application, 2022 & 2032F |
3.7 Qatar Fish Processing Market Revenues & Volume Share, By Processing, 2022 & 2032F |
3.8 Qatar Fish Processing Market Revenues & Volume Share, By Equipment, 2022 & 2032F |
4 Qatar Fish Processing Market Dynamics |
4.1 Impact Analysis |
4.2 Market Drivers |
4.3 Market Restraints |
5 Qatar Fish Processing Market Trends |
6 Qatar Fish Processing Market, By Types |
6.1 Qatar Fish Processing Market, By Source |
6.1.1 Overview and Analysis |
6.1.2 Qatar Fish Processing Market Revenues & Volume, By Source, 2022-2032F |
6.1.3 Qatar Fish Processing Market Revenues & Volume, By Marine, 2022-2032F |
6.1.4 Qatar Fish Processing Market Revenues & Volume, By Inland, 2022-2032F |
6.1.5 Qatar Fish Processing Market Revenues & Volume, By Freshwater, 2022-2032F |
6.2 Qatar Fish Processing Market, By Application |
6.2.1 Overview and Analysis |
6.2.2 Qatar Fish Processing Market Revenues & Volume, By Food, 2022-2032F |
6.2.3 Qatar Fish Processing Market Revenues & Volume, By Feed, 2022-2032F |
6.2.4 Qatar Fish Processing Market Revenues & Volume, By Biomedical, 2022-2032F |
6.2.5 Qatar Fish Processing Market Revenues & Volume, By Others, 2022-2032F |
6.3 Qatar Fish Processing Market, By Processing |
6.3.1 Overview and Analysis |
6.3.2 Qatar Fish Processing Market Revenues & Volume, By Frozen, 2022-2032F |
6.3.3 Qatar Fish Processing Market Revenues & Volume, By Preserved, 2022-2032F |
6.3.4 Qatar Fish Processing Market Revenues & Volume, By Others, 2022-2032F |
6.4 Qatar Fish Processing Market, By Equipment |
6.4.1 Overview and Analysis |
6.4.2 Qatar Fish Processing Market Revenues & Volume, By Gutting, 2022-2032F |
6.4.3 Qatar Fish Processing Market Revenues & Volume, By Scaling, 2022-2032F |
6.4.4 Qatar Fish Processing Market Revenues & Volume, By Filleting, 2022-2032F |
6.4.5 Qatar Fish Processing Market Revenues & Volume, By Deboning, 2022-2032F |
6.4.6 Qatar Fish Processing Market Revenues & Volume, By Skinning, 2022-2032F |
6.4.7 Qatar Fish Processing Market Revenues & Volume, By Curing & Smoking, 2022-2032F |
7 Qatar Fish Processing Market Import-Export Trade Statistics |
7.1 Qatar Fish Processing Market Export to Major Countries |
7.2 Qatar Fish Processing Market Imports from Major Countries |
8 Qatar Fish Processing Market Key Performance Indicators |
9 Qatar Fish Processing Market - Opportunity Assessment |
9.1 Qatar Fish Processing Market Opportunity Assessment, By Source, 2022 & 2032F |
9.2 Qatar Fish Processing Market Opportunity Assessment, By Application, 2022 & 2032F |
9.3 Qatar Fish Processing Market Opportunity Assessment, By Processing, 2022 & 2032F |
9.4 Qatar Fish Processing Market Opportunity Assessment, By Equipment, 2022 & 2032F |
10 Qatar Fish Processing Market - Competitive Landscape |
10.1 Qatar Fish Processing Market Revenue Share, By Companies, 2025 |
10.2 Qatar Fish Processing Market Competitive Benchmarking, By Operating and Technical Parameters |
11 Company Profiles |
12 Recommendations |
13 Disclaimer |
Global Go To Market Strategy - 2030
Export potential enables firms to identify high-growth global markets with greater confidence by combining advanced trade intelligence with a structured quantitative methodology. The framework analyzes emerging demand trends and country-level import patterns while integrating macroeconomic and trade datasets such as GDP and population forecasts, bilateral import–export flows, tariff structures, elasticity differentials between developed and developing economies, geographic distance, and import demand projections. Using weighted trade values from 2020–2024 as the base period to project country-to-country export potential for 2030, these inputs are operationalized through calculated drivers such as gravity model parameters, tariff impact factors, and projected GDP per-capita growth. Through an analysis of hidden potentials, demand hotspots, and market conditions that are most favorable to success, this method enables firms to focus on target countries, maximize returns, and global expansion with data, backed by accuracy.
By factoring in the projected importer demand gap that is currently unmet and could be potential opportunity, it identifies the potential for the Exporter (Country) among 190 countries, against the general trade analysis, which identifies the biggest importer or exporter.
To discover high-growth global markets and optimize your business strategy:
Click Here
Pricing
- Single User License$ 1,995
- Department License$ 2,400
- Site License$ 3,120
- Global License$ 3,795

Leadership Perspectives from Industry Events
Search
Thought Leadership and Analyst Meet


Our Clients
6WResearch In News
- India Air Conditioner Market Set for Strong Rebound in 2026 After Weather-Led Correction and GST-Driven Recovery: 6Wresearch
- ADAS in India: How Automatic Emergency Braking, Blind Spot Detection & Driver Monitoring are Transforming Road Safety
- Doha a strategic location for EV manufacturing hub: IPA Qatar
- Demand for luxury TVs surging in the GCC, says Samsung
- Empowering Growth: The Thriving Journey of Bangladesh’s Cable Industry
- Demand for luxury TVs surging in the GCC, says Samsung
Latest Reports
- Poland Fire Protection Systems Market (2026-2032)
- Cape Verde Portable Hand-Thrown Extinguisher Market (2026-2032)
- Canada Portable Hand-Thrown Extinguisher Market (2026-2032)
- Cameroon Portable Hand-Thrown Extinguisher Market (2026-2032)
- Burundi Portable Hand-Thrown Extinguisher Market (2026-2032)
- Burkina Faso Portable Hand-Thrown Extinguisher Market (2026-2032)
- Bulgaria Portable Hand-Thrown Extinguisher Market (2026-2032)
- Brunei Portable Hand-Thrown Extinguisher Market (2026-2032)
- Botswana Portable Hand-Thrown Extinguisher Market (2026-2032)
- Bosnia and Herzegovina Portable Hand-Thrown Extinguisher Market (2026-2032)
Industry Events and Analyst Meet

HIMTEX 2026

India Refining Summit 2026

India EV Show 2026

EV tech India Expo 2026

Auto Tech Asia 2026
Whitepaper
- Middle East & Africa Commercial Security Market Click here to view more.
- Middle East & Africa Fire Safety Systems & Equipment Market Click here to view more.
- GCC Drone Market Click here to view more.
- Middle East Lighting Fixture Market Click here to view more.
- GCC Physical & Perimeter Security Market Click here to view more.