United States (US) Television Market (2026-2032) | Forecast, Share, Analysis, Value, Companies, Growth, Trends, Size, Revenue, Industry & Outlook
Market Forecast By Resolution (LCD TVs, OLED TVs), By Types (2D TVs, 3D TVs) And Competitive Landscape
| Product Code: ETC036621 | Publication Date: Oct 2020 | Updated Date: Jun 2026 | Product Type: Report | |
| Publisher: 6Wresearch | Author: Bhawna Singh | No. of Pages: 70 | No. of Figures: 35 | No. of Tables: 5 |
United States (US) Television Market Summary
The united states (us) television market was estimated at USD 431 Million in 2025 and is projected to reach USD 576 Million by 2032, growing at a CAGR of 4.7% from 2026 to 2032.
United States (US) Television Market Year-wise Growth Rate and Key Drivers
This graph highlights how the United States (US) Television Market has steadily grown over the past five years, supported by major growth factors.
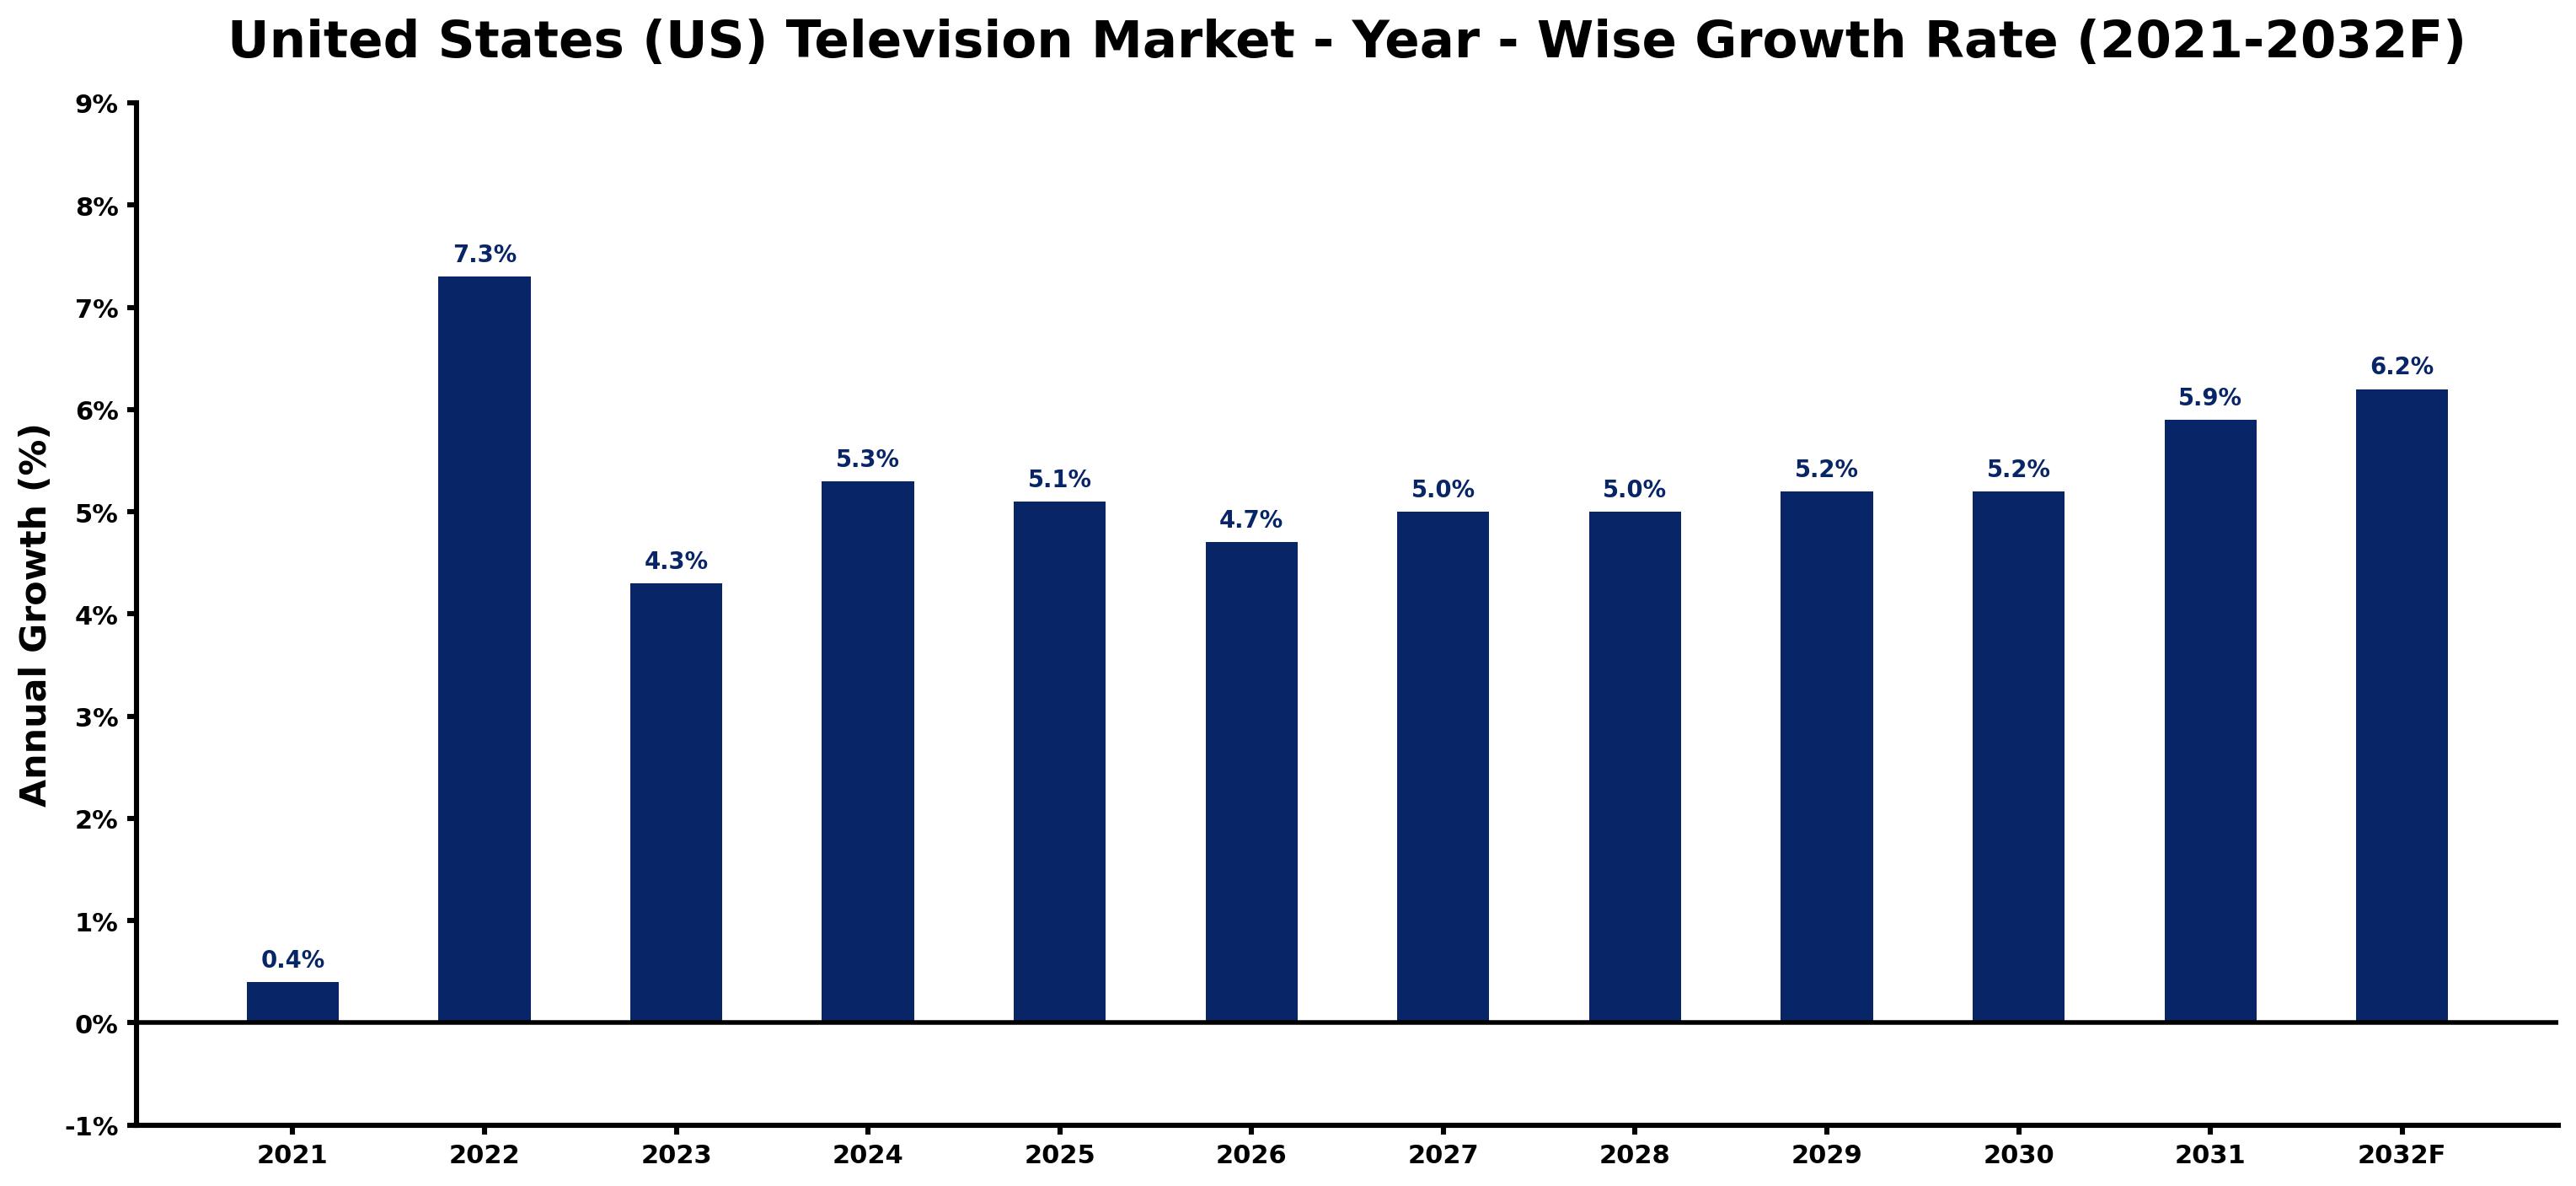
The table below presents the year wise growth rates along with the key drivers influencing the market
| Year | Growth Rate | Major Drivers |
| 2021 | 0.4% | Post-pandemic viewership trends shifted towards streaming platforms and on-demand content. |
| 2022 | 7.3% | Emerging technologies in content delivery reshaped traditional broadcasting dynamics significantly. |
| 2023 | 4.3% | Consumer preferences evolved, emphasizing personalized viewing experiences and niche programming. |
| 2024 | 5.3% | Advertisers increasingly recognized the value of targeted digital advertisement integration strategies. |
| 2025 | 5.1% | Innovative partnerships between tech firms and networks expanded distribution channels for content. |
| 2026 | 4.7% | New player entries introduced competition, driving content diversity and pricing strategy adjustments. |
| 2027 | 5.0% | Shifts in consumer behavior reflected a growing appreciation for interactive television formats. |
| 2028 | 5.0% | Enhanced broadband infrastructure facilitated smoother streaming experiences nationwide, attracting viewers. |
| 2029 | 5.2% | Original programming investments surged, enhancing brand loyalty among key demographic segments. |
| 2030 | 5.2% | Cross-platform integration became essential, blending social media with traditional television experiences. |
| 2031 | 5.9% | Sustainability initiatives influenced production decisions, appealing to environmentally conscious audiences. |
| 2032 | 6.2% | Audience fragmentation led networks to develop hyper-targeted content for diverse viewer segments. |
Note - Market size estimations and growth projections presented in this report are based on 6Wresearch's advanced forecasting approach, validated with industry datasets as of June 2026.
United States (US) Television Market Synopsis
The United States (US) Television Market is projected to reach 4.7% and witness significant growth during the forecast period (2026-2032). This market is renowned for its vast array of viewing options and its competitive landscape, where traditional cable and satellite services coexist with a surge in streaming platforms. Notably, services such as Netflix, Hulu, and Amazon Prime Video have captured increasing shares of consumer attention, further shifting viewing habits and preferences.
United States (US) Television Market Growth Drivers
Several factors are driving the growth of the United States (US) Television Market, shaping its future trajectory:
- The proliferation of streaming services is radically changing consumer behavior, with platforms offering flexible subscription models and extensive libraries of content that appeal to diverse demographics.
- Advancements in technology, particularly smart TVs and connected devices, have enhanced the way viewers consume content, making it more convenient to access platforms directly from their televisions.
- A growing trend towards on-demand content consumption reflects a shift in viewer expectations, emphasizing the need for ready availability and the ability to choose what and when to watch.
- Advertisers continue to heavily invest in television due to its capacity to reach wide audiences; with targeted advertising capabilities improving, businesses are finding new ways to engage consumers.
- The demand for high-quality original programming across platforms is fostering a competitive environment, leading to increased investment in content creation.
United States (US) Television Market Trends and Opportunities
The United States (US) Television Market is observing notable trends that present numerous opportunities for stakeholders:
- Subscription-based platforms are increasingly preferred, as cord-cutting trends hint at consumers moving away from traditional cable services in favor of more cost-effective streaming solutions.
- There is a marked increase in the production of exclusive original content, with streaming services engaging audiences through unique storytelling and high production values, which are enticing to subscribers.
- Interactive content and personalized viewing experiences are becoming significant selling points, attracting consumers who seek engagement beyond traditional viewing.
- The integration of advanced analytics is allowing content providers to better understand viewer preferences and tailor offerings accordingly, optimizing user satisfaction.
- Investment in advanced technology solutions—such as augmented reality (AR), virtual reality (VR), and Artificial Intelligence (AI) for content customization—presents opportunities for enhancing viewer engagement and experience.
United States (US) Television Market Challenges and Restraints
The United States (US) Television Market, while robust, faces several challenges that could impede growth:
- Intensifying competition from streaming platforms creates pressure on traditional providers to innovate and adapt their service offerings to retain subscribers.
- The fragmentation of viewership across various platforms complicates marketing strategies for television networks, making it harder to achieve substantial audience reach.
- As consumers favor on-demand content, traditional broadcasting faces declining viewership, which could adversely affect revenue streams from advertisements.
- The rapid evolution of technology necessitates continuous investment from companies, which can be a significant burden, especially for smaller players in the market.
- Regulatory changes or shifts in government policy could introduce additional challenges or limitations on market operations, altering competitive dynamics within the industry.
United States (US) Television Market Investment Opportunities
Investment opportunities within the United States (US) Television Market remain robust, driven by both established and emerging sectors:
- Investing in content production companies offers growth potential as demand for unique programming continues to rise, marking it as a resilient segment within the market.
- Established cable and satellite providers still hold significant market presence, representing investment avenues that may capitalize on partial shifts towards digital platforms.
- Emerging media technologies, particularly those enhancing the smart TV experience, present lucrative opportunities for investors seeking to align with current viewing trends.
- Investments in advertising technology firms can benefit from the enhanced targeting capabilities that are revolutionizing how brands connect with audiences.
- The growing emphasis on data analytics within television content delivery is giving rise to investment opportunities in firms developing these technological solutions.
United States (US) Television Market Government Investment and Initiatives
The regulatory landscape plays a crucial role in shaping the United States (US) Television Market. The Federal Communications Commission (FCC) is the primary governing body overseeing this sector, executing policies that foster competition and protect consumer rights:
- The FCC establishes content regulations that ensure inclusivity and diversity, such as the Children's Television Act, which mandates educational programming for younger audiences.
- Government initiatives encouraging technological innovation and infrastructure upgrades are aimed at enhancing the overall viewing experience for consumers.
- Public funding and incentives often support the development of broadcasting technology, assisting companies in adopting next-generation solutions.
- Ongoing consumer protection laws are designed to address issues related to pricing and content delivery, ensuring fair access across the competitive landscape.
- Government policies promoting fair competition seek to prevent monopolistic practices, aiming to maintain a healthy market environment for both traditional and emerging players.
United States (US) Television Market Latest Developments (May 2025 - June 2026)
In the period spanning May 2025 to June 2026, the United States (US) Television Market has experienced transformative developments:
- Streaming service subscriptions have continued to soar, with traditional cable networks launching complementary streaming platforms to adapt to the changing demands of consumers.
- Increased competition among content providers has resulted in innovative storytelling approaches, aiming to capture and retain viewer attention.
- Enhanced audience engagement strategies, including interactive content and personalized recommendations, have been increasingly adopted by various platforms.
- Investment in production technologies has surged as companies seek to create high-quality original content to compete effectively in a saturated market.
- Regulatory developments have introduced updates to advertising standards, reflecting the ongoing shifts in how advertisements are delivered and consumed, further influencing strategic decisions in the industry.
United States (US) Television Market - Key Attractiveness of the Report
- 10 Years of Market Numbers
- Historical Data Starting from 2022 to 2025
- Base Year: 2025
- Forecast Data until 2032
- Key Performance Indicators Impacting the Market
- Major Upcoming Developments and Projects
Key Highlights of the Report:
- United States (US) Television Market Outlook
- Market Size of United States (US) Television Market, 2025
- Forecast of United States (US) Television Market, 2032F
- Historical Data and Forecast of United States (US) Television Revenues & Volume for the Period 2022-2032F
- United States (US) Television Market Trend Evolution
- United States (US) Television Market Drivers and Challenges
- United States (US) Television Price Trends
- United States (US) Television Porter's Five Forces
- United States (US) Television Industry Life Cycle
- Historical Data and Forecast of United States (US) Television Market Revenues & Volume By Resolution for the Period 2022-2032F
- Historical Data and Forecast of United States (US) Television Market Revenues & Volume By LCD TVs for the Period 2022-2032F
- Historical Data and Forecast of United States (US) Television Market Revenues & Volume By OLED TVs for the Period 2022-2032F
- Historical Data and Forecast of United States (US) Television Market Revenues & Volume By Types for the Period 2022-2032F
- Historical Data and Forecast of United States (US) Television Market Revenues & Volume By 2D TVs for the Period 2022-2032F
- Historical Data and Forecast of United States (US) Television Market Revenues & Volume By 3D TVs for the Period 2022-2032F
- United States (US) Television Import Export Trade Statistics
- Market Opportunity Assessment By Resolution
- Market Opportunity Assessment By Types
- United States (US) Television Top Companies Market Share
- United States (US) Television Competitive Benchmarking By Technical and Operational Parameters
- United States (US) Television Company Profiles
- United States (US) Television Key Strategic Recommendations
Frequently Asked Questions About the Market Study (FAQs):
The primary drivers include the rise of streaming services, advancements in technology, and increasing demand for on-demand content.
Key challenges comprise intense competition from streaming platforms, audience fragmentation, and the need for continuous technological investments.
The regulatory environment, primarily governed by the FCC, focuses on promoting competition and protecting consumer rights while ensuring compliance with content standards.
Investment opportunities are abundant in content production, advertising technology, and emerging technologies that enhance the consumer viewing experience.
6Wresearch actively monitors the United States (US) Television Market and publishes its comprehensive annual report, highlighting emerging trends, growth drivers, revenue analysis, and forecast outlook. Our insights help businesses to make data-backed strategic decisions with ongoing market dynamics. Our analysts track relevent industries related to the United States (US) Television Market, allowing our clients with actionable intelligence and reliable forecasts tailored to emerging regional needs.
Yes, we provide customisation as per your requirements. To learn more, feel free to contact us on sales@6wresearch.com
1 Executive Summary |
2 Introduction |
2.1 Key Highlights of the Report |
2.2 Report Description |
2.3 Market Scope & Segmentation |
2.4 Research Methodology |
2.5 Assumptions |
3 United States (US) Television Market Overview |
3.1 United States (US) Country Macro Economic Indicators |
3.2 United States (US) Television Market Revenues & Volume, 2022 & 2032F |
3.3 United States (US) Television Market - Industry Life Cycle |
3.4 United States (US) Television Market - Porter's Five Forces |
3.5 United States (US) Television Market Revenues & Volume Share, By Resolution, 2022 & 2032F |
3.6 United States (US) Television Market Revenues & Volume Share, By Types, 2022 & 2032F |
4 United States (US) Television Market Dynamics |
4.1 Impact Analysis |
4.2 Market Drivers |
4.2.1 Increasing demand for high-quality content and original programming |
4.2.2 Technological advancements leading to innovations in TV viewing experiences |
4.2.3 Growing penetration of smart TVs and streaming services |
4.3 Market Restraints |
4.3.1 Intense competition among traditional TV broadcasters and streaming platforms |
4.3.2 Adverse economic conditions impacting advertising budgets |
4.3.3 Shifting consumer preferences towards online video content consumption |
5 United States (US) Television Market Trends |
6 United States (US) Television Market, By Types |
6.1 United States (US) Television Market, By Resolution |
6.1.1 Overview and Analysis |
6.1.2 United States (US) Television Market Revenues & Volume, By Resolution, 2022-2032F |
6.1.3 United States (US) Television Market Revenues & Volume, By LCD TVs, 2022-2032F |
6.1.4 United States (US) Television Market Revenues & Volume, By OLED TVs, 2022-2032F |
6.2 United States (US) Television Market, By Types |
6.2.1 Overview and Analysis |
6.2.2 United States (US) Television Market Revenues & Volume, By 2D TVs, 2022-2032F |
6.2.3 United States (US) Television Market Revenues & Volume, By 3D TVs, 2022-2032F |
7 United States (US) Television Market Import-Export Trade Statistics |
7.1 United States (US) Television Market Export to Major Countries |
7.2 United States (US) Television Market Imports from Major Countries |
8 United States (US) Television Market Key Performance Indicators |
8.1 Average viewing time per TV household |
8.2 Growth in subscription numbers for streaming services |
8.3 Adoption rate of smart TVs |
8.4 Engagement metrics on social media platforms for TV shows |
8.5 Number of partnerships between TV networks and content creators |
9 United States (US) Television Market - Opportunity Assessment |
9.1 United States (US) Television Market Opportunity Assessment, By Resolution, 2022 & 2032F |
9.2 United States (US) Television Market Opportunity Assessment, By Types, 2022 & 2032F |
10 United States (US) Television Market - Competitive Landscape |
10.1 United States (US) Television Market Revenue Share, By Companies, 2025 |
10.2 United States (US) Television Market Competitive Benchmarking, By Operating and Technical Parameters |
11 Company Profiles |
12 Recommendations |
13 Disclaimer |
Global Go To Market Strategy - 2030
Export potential enables firms to identify high-growth global markets with greater confidence by combining advanced trade intelligence with a structured quantitative methodology. The framework analyzes emerging demand trends and country-level import patterns while integrating macroeconomic and trade datasets such as GDP and population forecasts, bilateral import–export flows, tariff structures, elasticity differentials between developed and developing economies, geographic distance, and import demand projections. Using weighted trade values from 2020–2024 as the base period to project country-to-country export potential for 2030, these inputs are operationalized through calculated drivers such as gravity model parameters, tariff impact factors, and projected GDP per-capita growth. Through an analysis of hidden potentials, demand hotspots, and market conditions that are most favorable to success, this method enables firms to focus on target countries, maximize returns, and global expansion with data, backed by accuracy.
By factoring in the projected importer demand gap that is currently unmet and could be potential opportunity, it identifies the potential for the Exporter (Country) among 190 countries, against the general trade analysis, which identifies the biggest importer or exporter.
To discover high-growth global markets and optimize your business strategy:
Click Here
Pricing
- Single User License$ 1,995
- Department License$ 2,400
- Site License$ 3,120
- Global License$ 3,795

Leadership Perspectives from Industry Events
Search
Thought Leadership and Analyst Meet


Our Clients
6WResearch In News
- India Air Conditioner Market Set for Strong Rebound in 2026 After Weather-Led Correction and GST-Driven Recovery: 6Wresearch
- ADAS in India: How Automatic Emergency Braking, Blind Spot Detection & Driver Monitoring are Transforming Road Safety
- Doha a strategic location for EV manufacturing hub: IPA Qatar
- Demand for luxury TVs surging in the GCC, says Samsung
- Empowering Growth: The Thriving Journey of Bangladesh’s Cable Industry
- Demand for luxury TVs surging in the GCC, says Samsung
Latest Reports
- Nicaragua RPG Gaming Market (2026-2032)
- New Zealand RPG Gaming Market (2026-2032)
- Netherlands RPG Gaming Market (2026-2032)
- Nauru RPG Gaming Market (2026-2032)
- Namibia RPG Gaming Market (2026-2032)
- Mozambique RPG Gaming Market (2026-2032)
- Montenegro RPG Gaming Market (2026-2032)
- Mongolia RPG Gaming Market (2026-2032)
- Monaco RPG Gaming Market (2026-2032)
- Micronesia RPG Gaming Market (2026-2032)
Industry Events and Analyst Meet

EV India Expo 2026

HIMTEX 2026

India Refining Summit 2026

India EV Show 2026

EV tech India Expo 2026
Whitepaper
- Middle East & Africa Commercial Security Market Click here to view more.
- Middle East & Africa Fire Safety Systems & Equipment Market Click here to view more.
- GCC Drone Market Click here to view more.
- Middle East Lighting Fixture Market Click here to view more.
- GCC Physical & Perimeter Security Market Click here to view more.