Jordan Chlorine Market Outlook | Analysis, Trends, Size, Share, COVID-19 IMPACT, Companies, Industry, Growth, Forecast, Revenue & Value
Market Forecast By Application (EDC/PVC, Isocyanates and Oxygenates, Chloromethanes, Solvents and Epichlorohydrin, Inorganic Chemicals, Other Applications), By End-user Industry (Water Treatment, Pharmaceutical, Chemicals, Paper and Pulp, Plastic, Pesticides, Other End-user Industries) And Competitive Landscape
| Product Code: ETC191278 | Publication Date: May 2022 | Updated Date: Aug 2025 | Product Type: Market Research Report | |
| Publisher: 6Wresearch | Author: Ravi Bhandari | No. of Pages: 60 | No. of Figures: 40 | No. of Tables: 7 |
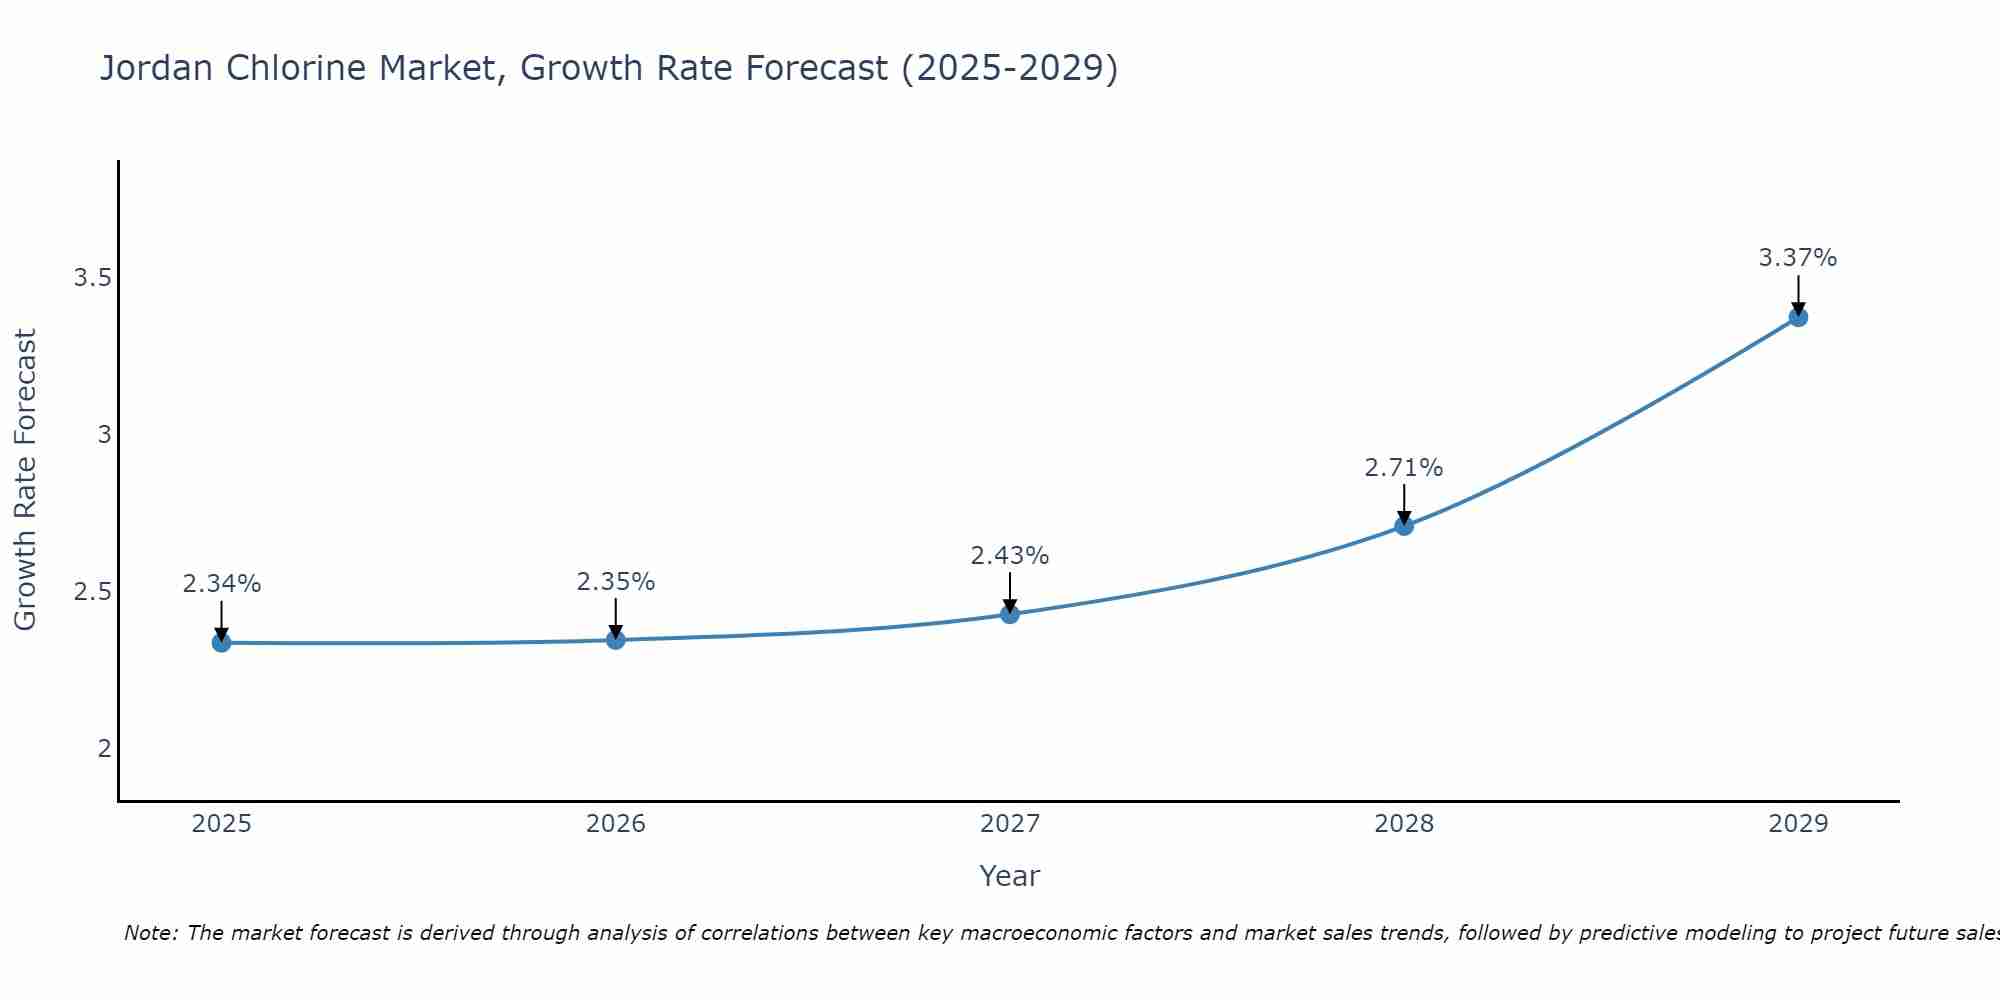
Jordan Chlorine Market Size Growth Rate
The Jordan Chlorine Market is poised for steady growth rate improvements from 2025 to 2029. The growth rate starts at 2.34% in 2025 and reaches 3.37% by 2029.
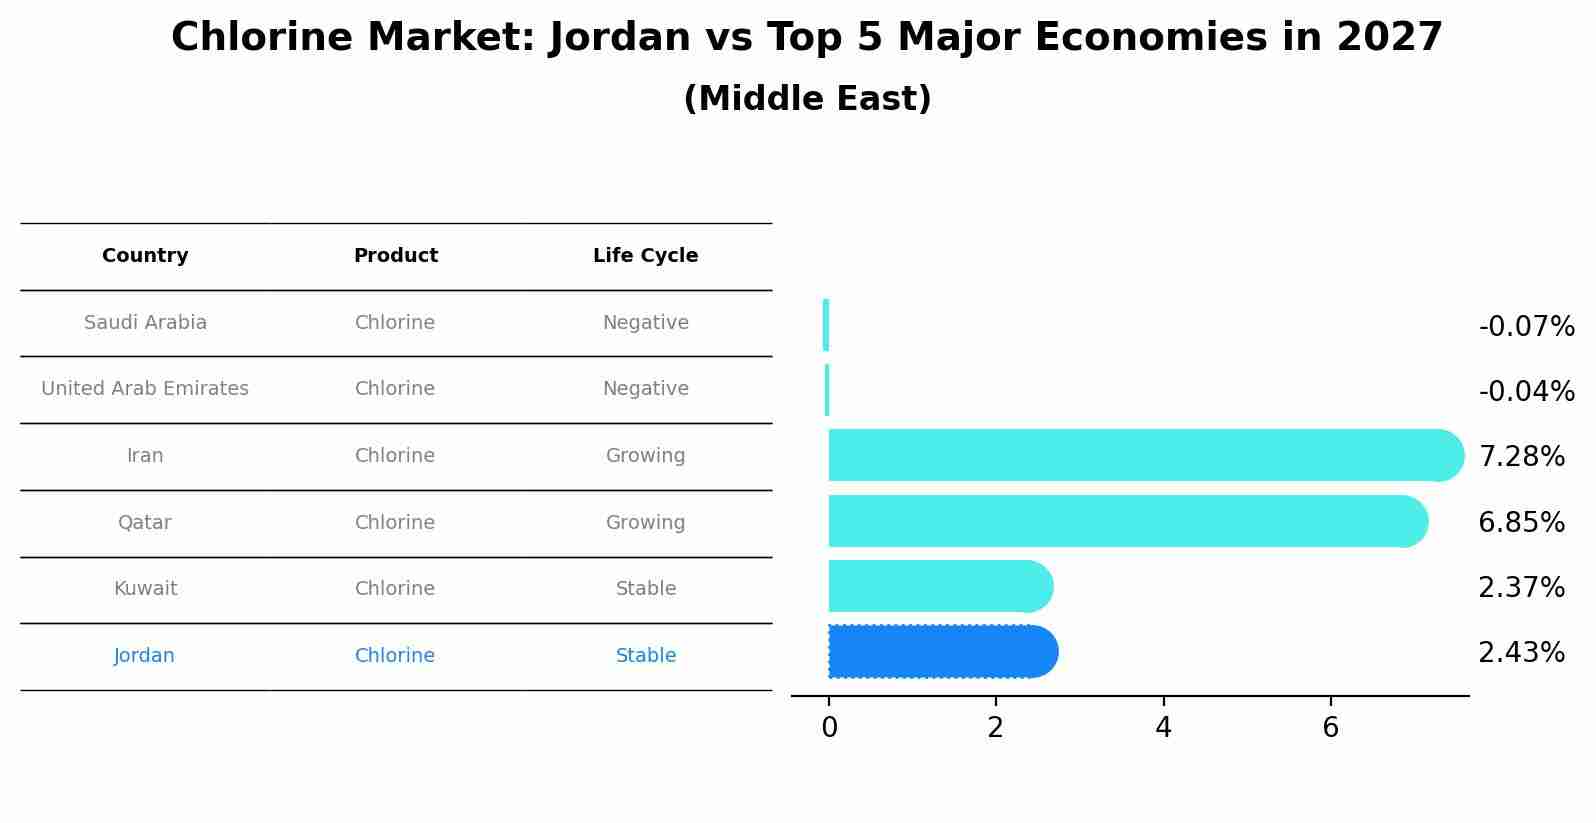
Chlorine Market: Jordan vs Top 5 Major Economies in 2027 (Middle East)
The Chlorine market in Jordan is projected to grow at a stable growth rate of 2.43% by 2027, highlighting the country's increasing focus on advanced technologies within the Middle East region, where Saudi Arabia holds the dominant position, followed closely by United Arab Emirates, Iran, Qatar and Kuwait, shaping overall regional demand.
Jordan Chlorine Market Overview
The Jordan Chlorine market is integral to several industrial processes including water treatment, sanitation, and chemical synthesis. Jordan growing population and industrialization are driving the demand for chlorine. The market comprises both domestic production and imports to meet the country`s requirements. Stringent regulations regarding water quality and sanitation further contribute to the steady growth of the chlorine market in Jordan.
Drivers of the market
In the Jordan chlorine market, the key drivers include the country`s reliance on chlorine for water treatment purposes, as well as its utilization in the production of various chemicals such as PVC, solvents, and agrochemicals. With water treatment being a critical aspect of public health infrastructure in Jordan, the demand for chlorine remains steady. Additionally, the chemical industry`s growth, coupled with rising agricultural activities, sustains the demand for chlorine-based products, supporting market expansion.
Challenges of the market
The chlorine market in Jordan is confronted with challenges such as the volatility in raw material prices and the high costs associated with production and transportation. Additionally, the market is affected by stringent environmental regulations, which demand significant investments in pollution control technologies. Another challenge is the competition from alternative disinfectants and chemicals, which can offer more cost-effective or environmentally friendly solutions.
Government Policy of the market
The chlorine market in Jordan is governed by policies that prioritize safe handling, storage, and transportation. The Ministry of Industry, Trade and Supply enforces regulations that align with international chemical safety standards. Importation of chlorine is subject to strict controls to prevent illegal distribution and ensure that only certified entities manage chlorine supplies, particularly for water purification and industrial use.
Key Highlights of the Report:
- Jordan Chlorine Market Outlook
- Market Size of Jordan Chlorine Market, 2024
- Forecast of Jordan Chlorine Market, 2031
- Historical Data and Forecast of Jordan Chlorine Revenues & Volume for the Period 2018 - 2031
- Jordan Chlorine Market Trend Evolution
- Jordan Chlorine Market Drivers and Challenges
- Jordan Chlorine Price Trends
- Jordan Chlorine Porter's Five Forces
- Jordan Chlorine Industry Life Cycle
- Historical Data and Forecast of Jordan Chlorine Market Revenues & Volume By Application for the Period 2018 - 2031
- Historical Data and Forecast of Jordan Chlorine Market Revenues & Volume By EDC/PVC for the Period 2018 - 2031
- Historical Data and Forecast of Jordan Chlorine Market Revenues & Volume By Isocyanates and Oxygenates for the Period 2018 - 2031
- Historical Data and Forecast of Jordan Chlorine Market Revenues & Volume By Chloromethanes for the Period 2018 - 2031
- Historical Data and Forecast of Jordan Chlorine Market Revenues & Volume By Solvents and Epichlorohydrin for the Period 2018 - 2031
- Historical Data and Forecast of Jordan Chlorine Market Revenues & Volume By Inorganic Chemicals for the Period 2018 - 2031
- Historical Data and Forecast of Jordan Chlorine Market Revenues & Volume By Other Applications for the Period 2018 - 2031
- Historical Data and Forecast of Jordan Chlorine Market Revenues & Volume By End-user Industry for the Period 2018 - 2031
- Historical Data and Forecast of Jordan Chlorine Market Revenues & Volume By Water Treatment for the Period 2018 - 2031
- Historical Data and Forecast of Jordan Chlorine Market Revenues & Volume By Pharmaceutical for the Period 2018 - 2031
- Historical Data and Forecast of Jordan Chlorine Market Revenues & Volume By Chemicals for the Period 2018 - 2031
- Historical Data and Forecast of Jordan Chlorine Market Revenues & Volume By Paper and Pulp for the Period 2018 - 2031
- Historical Data and Forecast of Jordan Chlorine Market Revenues & Volume By Plastic for the Period 2018 - 2031
- Historical Data and Forecast of Jordan Chlorine Market Revenues & Volume By Pesticides for the Period 2018 - 2031
- Historical Data and Forecast of Jordan Chlorine Market Revenues & Volume By Other End-user Industries for the Period 2018 - 2031
- Jordan Chlorine Import Export Trade Statistics
- Market Opportunity Assessment By Application
- Market Opportunity Assessment By End-user Industry
- Jordan Chlorine Top Companies Market Share
- Jordan Chlorine Competitive Benchmarking By Technical and Operational Parameters
- Jordan Chlorine Company Profiles
- Jordan Chlorine Key Strategic Recommendations
Frequently Asked Questions About the Market Study (FAQs):
6Wresearch actively monitors the Jordan Chlorine Market and publishes its comprehensive annual report, highlighting emerging trends, growth drivers, revenue analysis, and forecast outlook. Our insights help businesses to make data-backed strategic decisions with ongoing market dynamics. Our analysts track relevent industries related to the Jordan Chlorine Market, allowing our clients with actionable intelligence and reliable forecasts tailored to emerging regional needs.
Yes, we provide customisation as per your requirements. To learn more, feel free to contact us on sales@6wresearch.com
1 Executive Summary |
2 Introduction |
2.1 Key Highlights of the Report |
2.2 Report Description |
2.3 Market Scope & Segmentation |
2.4 Research Methodology |
2.5 Assumptions |
3 Jordan Chlorine Market Overview |
3.1 Jordan Country Macro Economic Indicators |
3.2 Jordan Chlorine Market Revenues & Volume, 2021 & 2031F |
3.3 Jordan Chlorine Market - Industry Life Cycle |
3.4 Jordan Chlorine Market - Porter's Five Forces |
3.5 Jordan Chlorine Market Revenues & Volume Share, By Application, 2021 & 2031F |
3.6 Jordan Chlorine Market Revenues & Volume Share, By End-user Industry, 2021 & 2031F |
4 Jordan Chlorine Market Dynamics |
4.1 Impact Analysis |
4.2 Market Drivers |
4.2.1 Growing demand for water treatment solutions in Jordan |
4.2.2 Increasing awareness about the importance of water sanitation and hygiene |
4.2.3 Government initiatives promoting the use of chlorine for water treatment |
4.3 Market Restraints |
4.3.1 Fluctuating prices of raw materials for chlorine production |
4.3.2 Environmental concerns related to chlorine usage |
4.3.3 Competition from alternative water treatment technologies |
5 Jordan Chlorine Market Trends |
6 Jordan Chlorine Market, By Types |
6.1 Jordan Chlorine Market, By Application |
6.1.1 Overview and Analysis |
6.1.2 Jordan Chlorine Market Revenues & Volume, By Application, 2021-2031F |
6.1.3 Jordan Chlorine Market Revenues & Volume, By EDC/PVC, 2021-2031F |
6.1.4 Jordan Chlorine Market Revenues & Volume, By Isocyanates and Oxygenates, 2021-2031F |
6.1.5 Jordan Chlorine Market Revenues & Volume, By Chloromethanes, 2021-2031F |
6.1.6 Jordan Chlorine Market Revenues & Volume, By Solvents and Epichlorohydrin, 2021-2031F |
6.1.7 Jordan Chlorine Market Revenues & Volume, By Inorganic Chemicals, 2021-2031F |
6.1.8 Jordan Chlorine Market Revenues & Volume, By Other Applications, 2021-2031F |
6.2 Jordan Chlorine Market, By End-user Industry |
6.2.1 Overview and Analysis |
6.2.2 Jordan Chlorine Market Revenues & Volume, By Water Treatment, 2021-2031F |
6.2.3 Jordan Chlorine Market Revenues & Volume, By Pharmaceutical, 2021-2031F |
6.2.4 Jordan Chlorine Market Revenues & Volume, By Chemicals, 2021-2031F |
6.2.5 Jordan Chlorine Market Revenues & Volume, By Paper and Pulp, 2021-2031F |
6.2.6 Jordan Chlorine Market Revenues & Volume, By Plastic, 2021-2031F |
6.2.7 Jordan Chlorine Market Revenues & Volume, By Pesticides, 2021-2031F |
7 Jordan Chlorine Market Import-Export Trade Statistics |
7.1 Jordan Chlorine Market Export to Major Countries |
7.2 Jordan Chlorine Market Imports from Major Countries |
8 Jordan Chlorine Market Key Performance Indicators |
8.1 Percentage of households with access to treated water |
8.2 Number of water treatment facilities using chlorine in Jordan |
8.3 Compliance rate of water treatment plants with chlorine usage regulations |
8.4 Investment in research and development for chlorine production technologies |
8.5 Number of partnerships and collaborations for promoting chlorine usage in water treatment |
9 Jordan Chlorine Market - Opportunity Assessment |
9.1 Jordan Chlorine Market Opportunity Assessment, By Application, 2021 & 2031F |
9.2 Jordan Chlorine Market Opportunity Assessment, By End-user Industry, 2021 & 2031F |
10 Jordan Chlorine Market - Competitive Landscape |
10.1 Jordan Chlorine Market Revenue Share, By Companies, 2024 |
10.2 Jordan Chlorine Market Competitive Benchmarking, By Operating and Technical Parameters |
11 Company Profiles |
12 Recommendations |
13 Disclaimer |
Global Go To Market Strategy - 2030
Export potential enables firms to identify high-growth global markets with greater confidence by combining advanced trade intelligence with a structured quantitative methodology. The framework analyzes emerging demand trends and country-level import patterns while integrating macroeconomic and trade datasets such as GDP and population forecasts, bilateral import–export flows, tariff structures, elasticity differentials between developed and developing economies, geographic distance, and import demand projections. Using weighted trade values from 2020–2024 as the base period to project country-to-country export potential for 2030, these inputs are operationalized through calculated drivers such as gravity model parameters, tariff impact factors, and projected GDP per-capita growth. Through an analysis of hidden potentials, demand hotspots, and market conditions that are most favorable to success, this method enables firms to focus on target countries, maximize returns, and global expansion with data, backed by accuracy.
By factoring in the projected importer demand gap that is currently unmet and could be potential opportunity, it identifies the potential for the Exporter (Country) among 190 countries, against the general trade analysis, which identifies the biggest importer or exporter.
To discover high-growth global markets and optimize your business strategy:
Click Here
Pricing
- Single User License$ 1,995
- Department License$ 2,400
- Site License$ 3,120
- Global License$ 3,795

Leadership Perspectives from Industry Events
Search
Thought Leadership and Analyst Meet


Our Clients
6WResearch In News
- India Air Conditioner Market Set for Strong Rebound in 2026 After Weather-Led Correction and GST-Driven Recovery: 6Wresearch
- ADAS in India: How Automatic Emergency Braking, Blind Spot Detection & Driver Monitoring are Transforming Road Safety
- Doha a strategic location for EV manufacturing hub: IPA Qatar
- Demand for luxury TVs surging in the GCC, says Samsung
- Empowering Growth: The Thriving Journey of Bangladesh’s Cable Industry
- Demand for luxury TVs surging in the GCC, says Samsung
Latest Reports
- Poland Fire Protection Systems Market (2026-2032)
- Cape Verde Portable Hand-Thrown Extinguisher Market (2026-2032)
- Canada Portable Hand-Thrown Extinguisher Market (2026-2032)
- Cameroon Portable Hand-Thrown Extinguisher Market (2026-2032)
- Burundi Portable Hand-Thrown Extinguisher Market (2026-2032)
- Burkina Faso Portable Hand-Thrown Extinguisher Market (2026-2032)
- Bulgaria Portable Hand-Thrown Extinguisher Market (2026-2032)
- Brunei Portable Hand-Thrown Extinguisher Market (2026-2032)
- Botswana Portable Hand-Thrown Extinguisher Market (2026-2032)
- Bosnia and Herzegovina Portable Hand-Thrown Extinguisher Market (2026-2032)
Industry Events and Analyst Meet

HIMTEX 2026

India Refining Summit 2026

India EV Show 2026

EV tech India Expo 2026

Auto Tech Asia 2026
Whitepaper
- Middle East & Africa Commercial Security Market Click here to view more.
- Middle East & Africa Fire Safety Systems & Equipment Market Click here to view more.
- GCC Drone Market Click here to view more.
- Middle East Lighting Fixture Market Click here to view more.
- GCC Physical & Perimeter Security Market Click here to view more.