Lithuania Chlorine Market (2026-2032) | Forecast, Analysis, Size, Growth, Industry, Companies, Revenue, Share, Segmentation, Value, Trends & Outlook
Market Forecast By Application (EDC/PVC, Isocyanates and Oxygenates, Chloromethanes, Solvents and Epichlorohydrin, Inorganic Chemicals, Other Applications), By End-user (Water Treatment, Pharmaceutical, Chemicals, Paper and Pulp, Plastic, Pesticides, Other) And Competitive Landscape
| Product Code: ETC4820644 | Publication Date: Nov 2023 | Updated Date: Apr 2026 | Product Type: Market Research Report | |
| Publisher: 6Wresearch | Author: Shubham Padhi | No. of Pages: 60 | No. of Figures: 30 | No. of Tables: 5 |
Lithuania Chlorine Market Size (2020-2030)
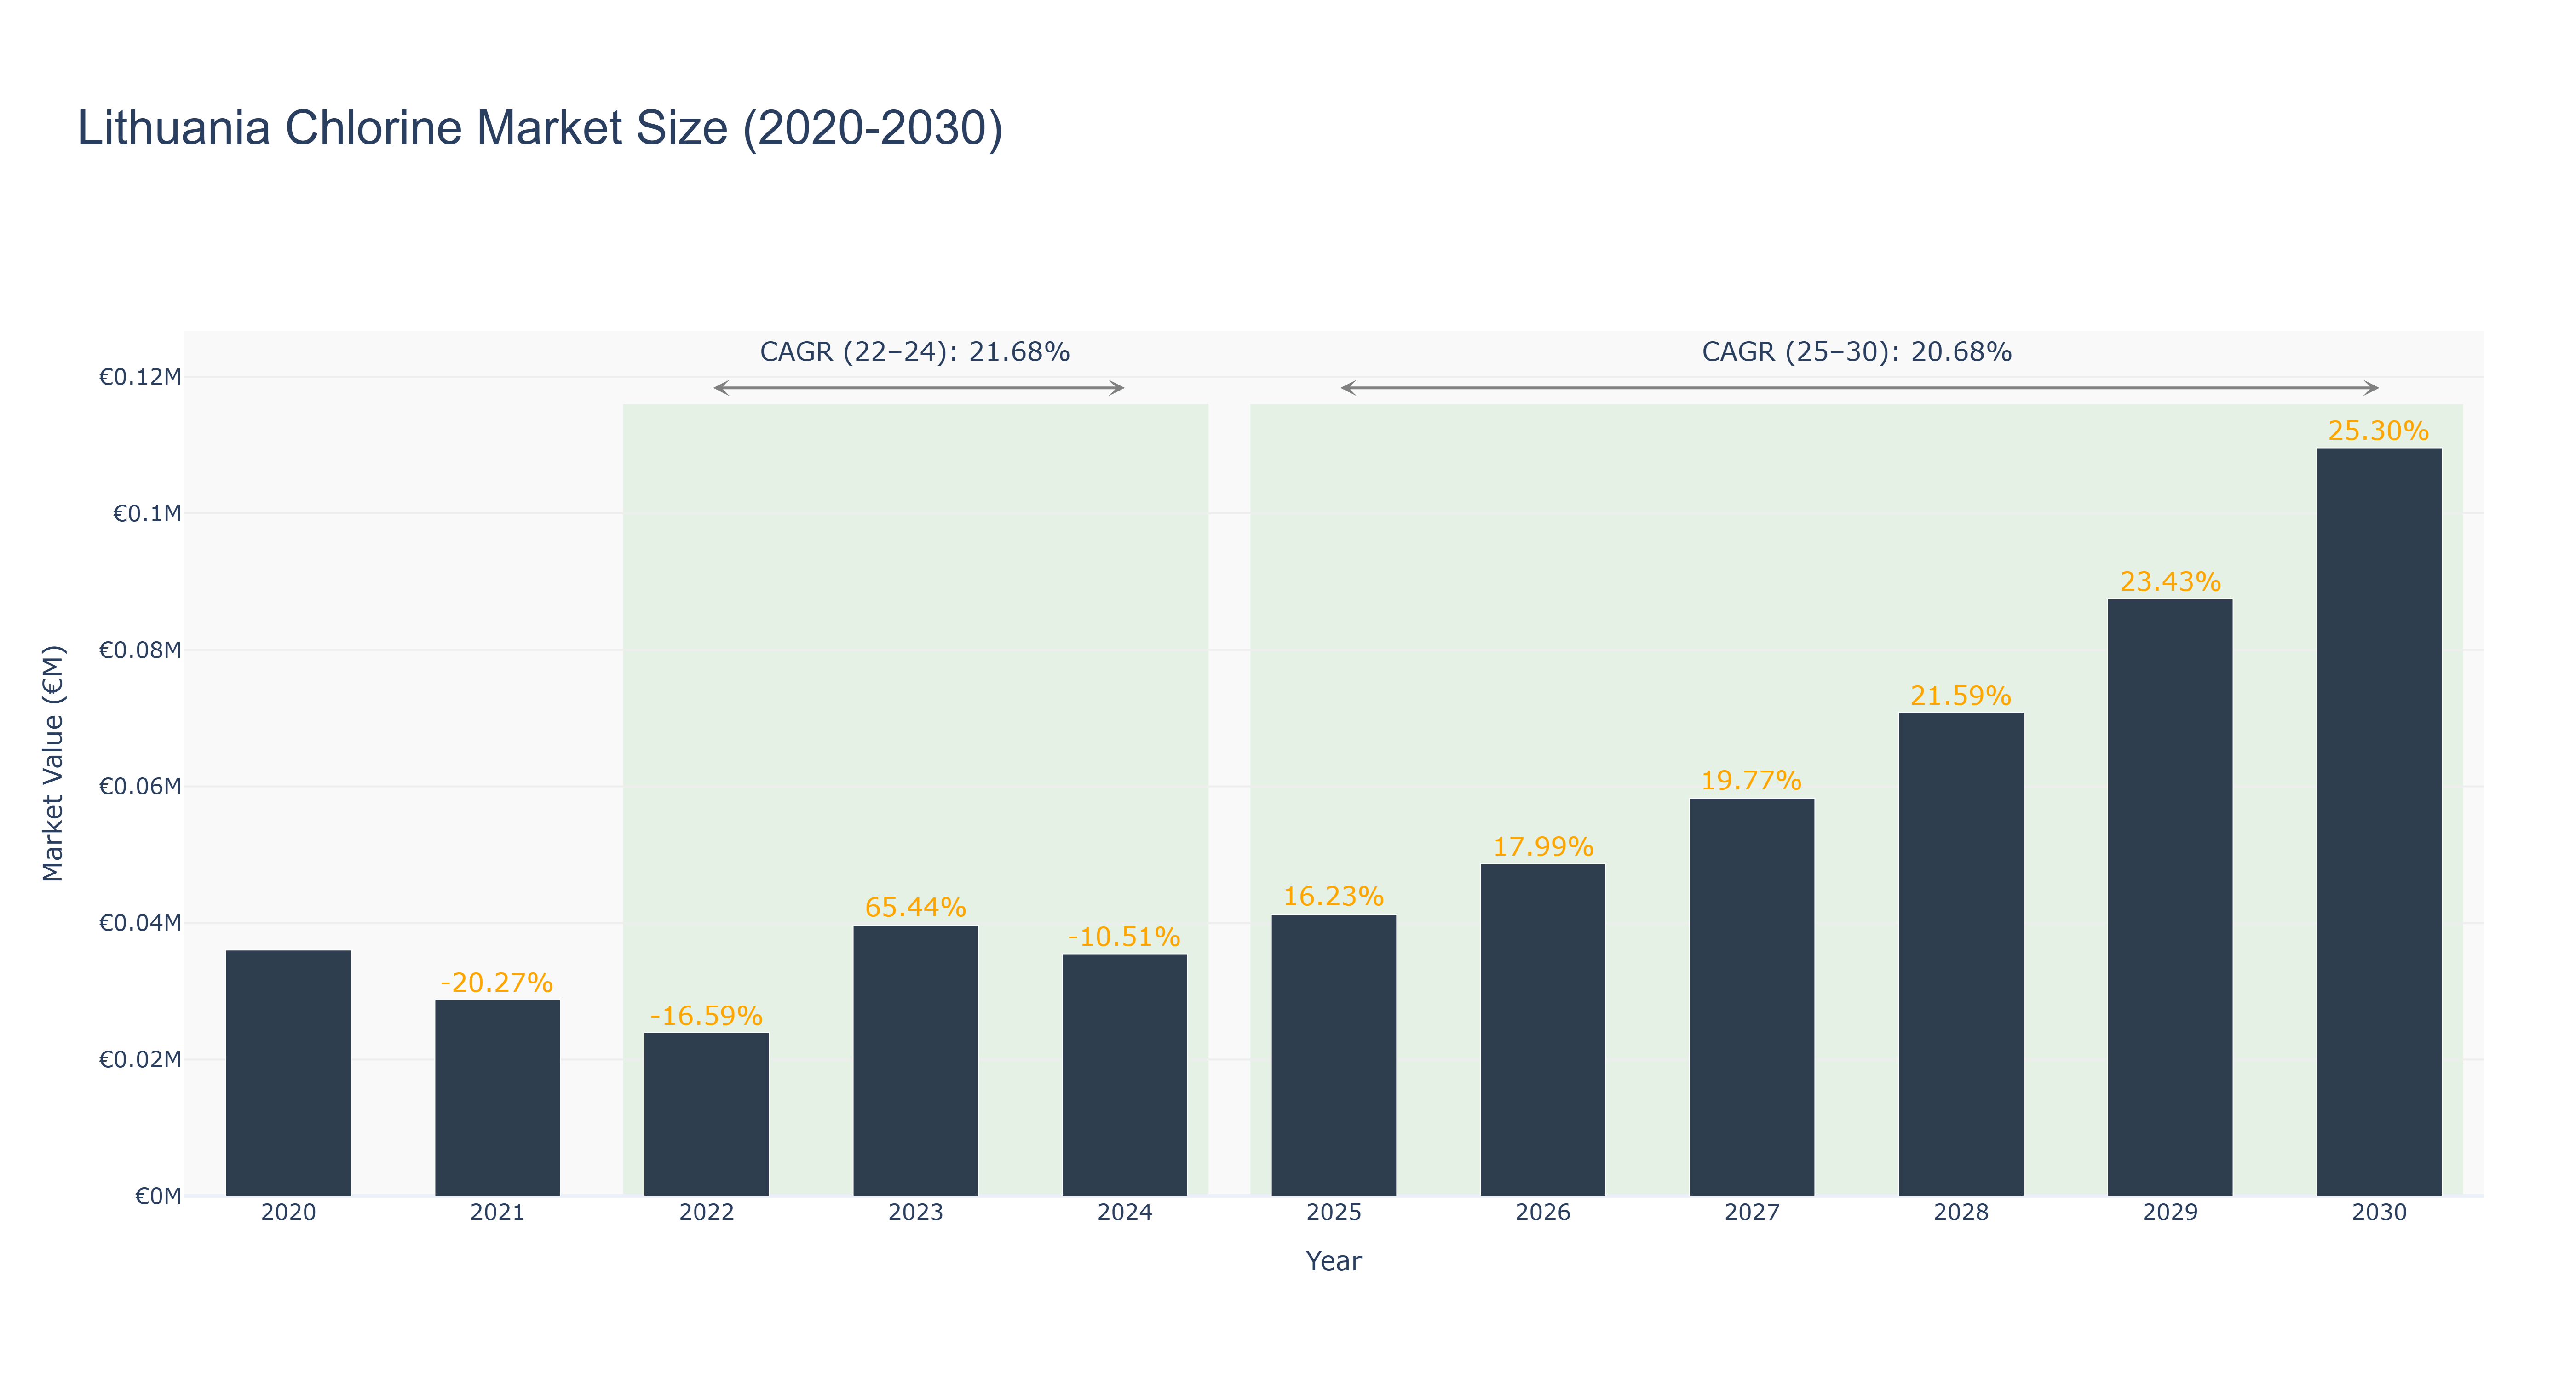
The Lithuania Chlorine Market has shown a fluctuating trend over the past decade. The peak market size of €0.11 million was reached in 2030, with a steady growth rate. From 2020 to 2024, the market size decreased from €0.04 million to €0.04 million due to a negative growth rate, rebounding in 2025 with a 16.23% growth. The forecasted market size from 2025 to 2030 is expected to continue growing at a CAGR of 20.68%. Industry drivers such as increasing demand for water treatment solutions and the expanding chemical industry have contributed to this growth. Looking ahead, Lithuania is set to invest in modernizing its water treatment infrastructure, which will further boost the Chlorine Market in the country.
Lithuania Chlorine Market: Production & Trade Performance (2019-2025)
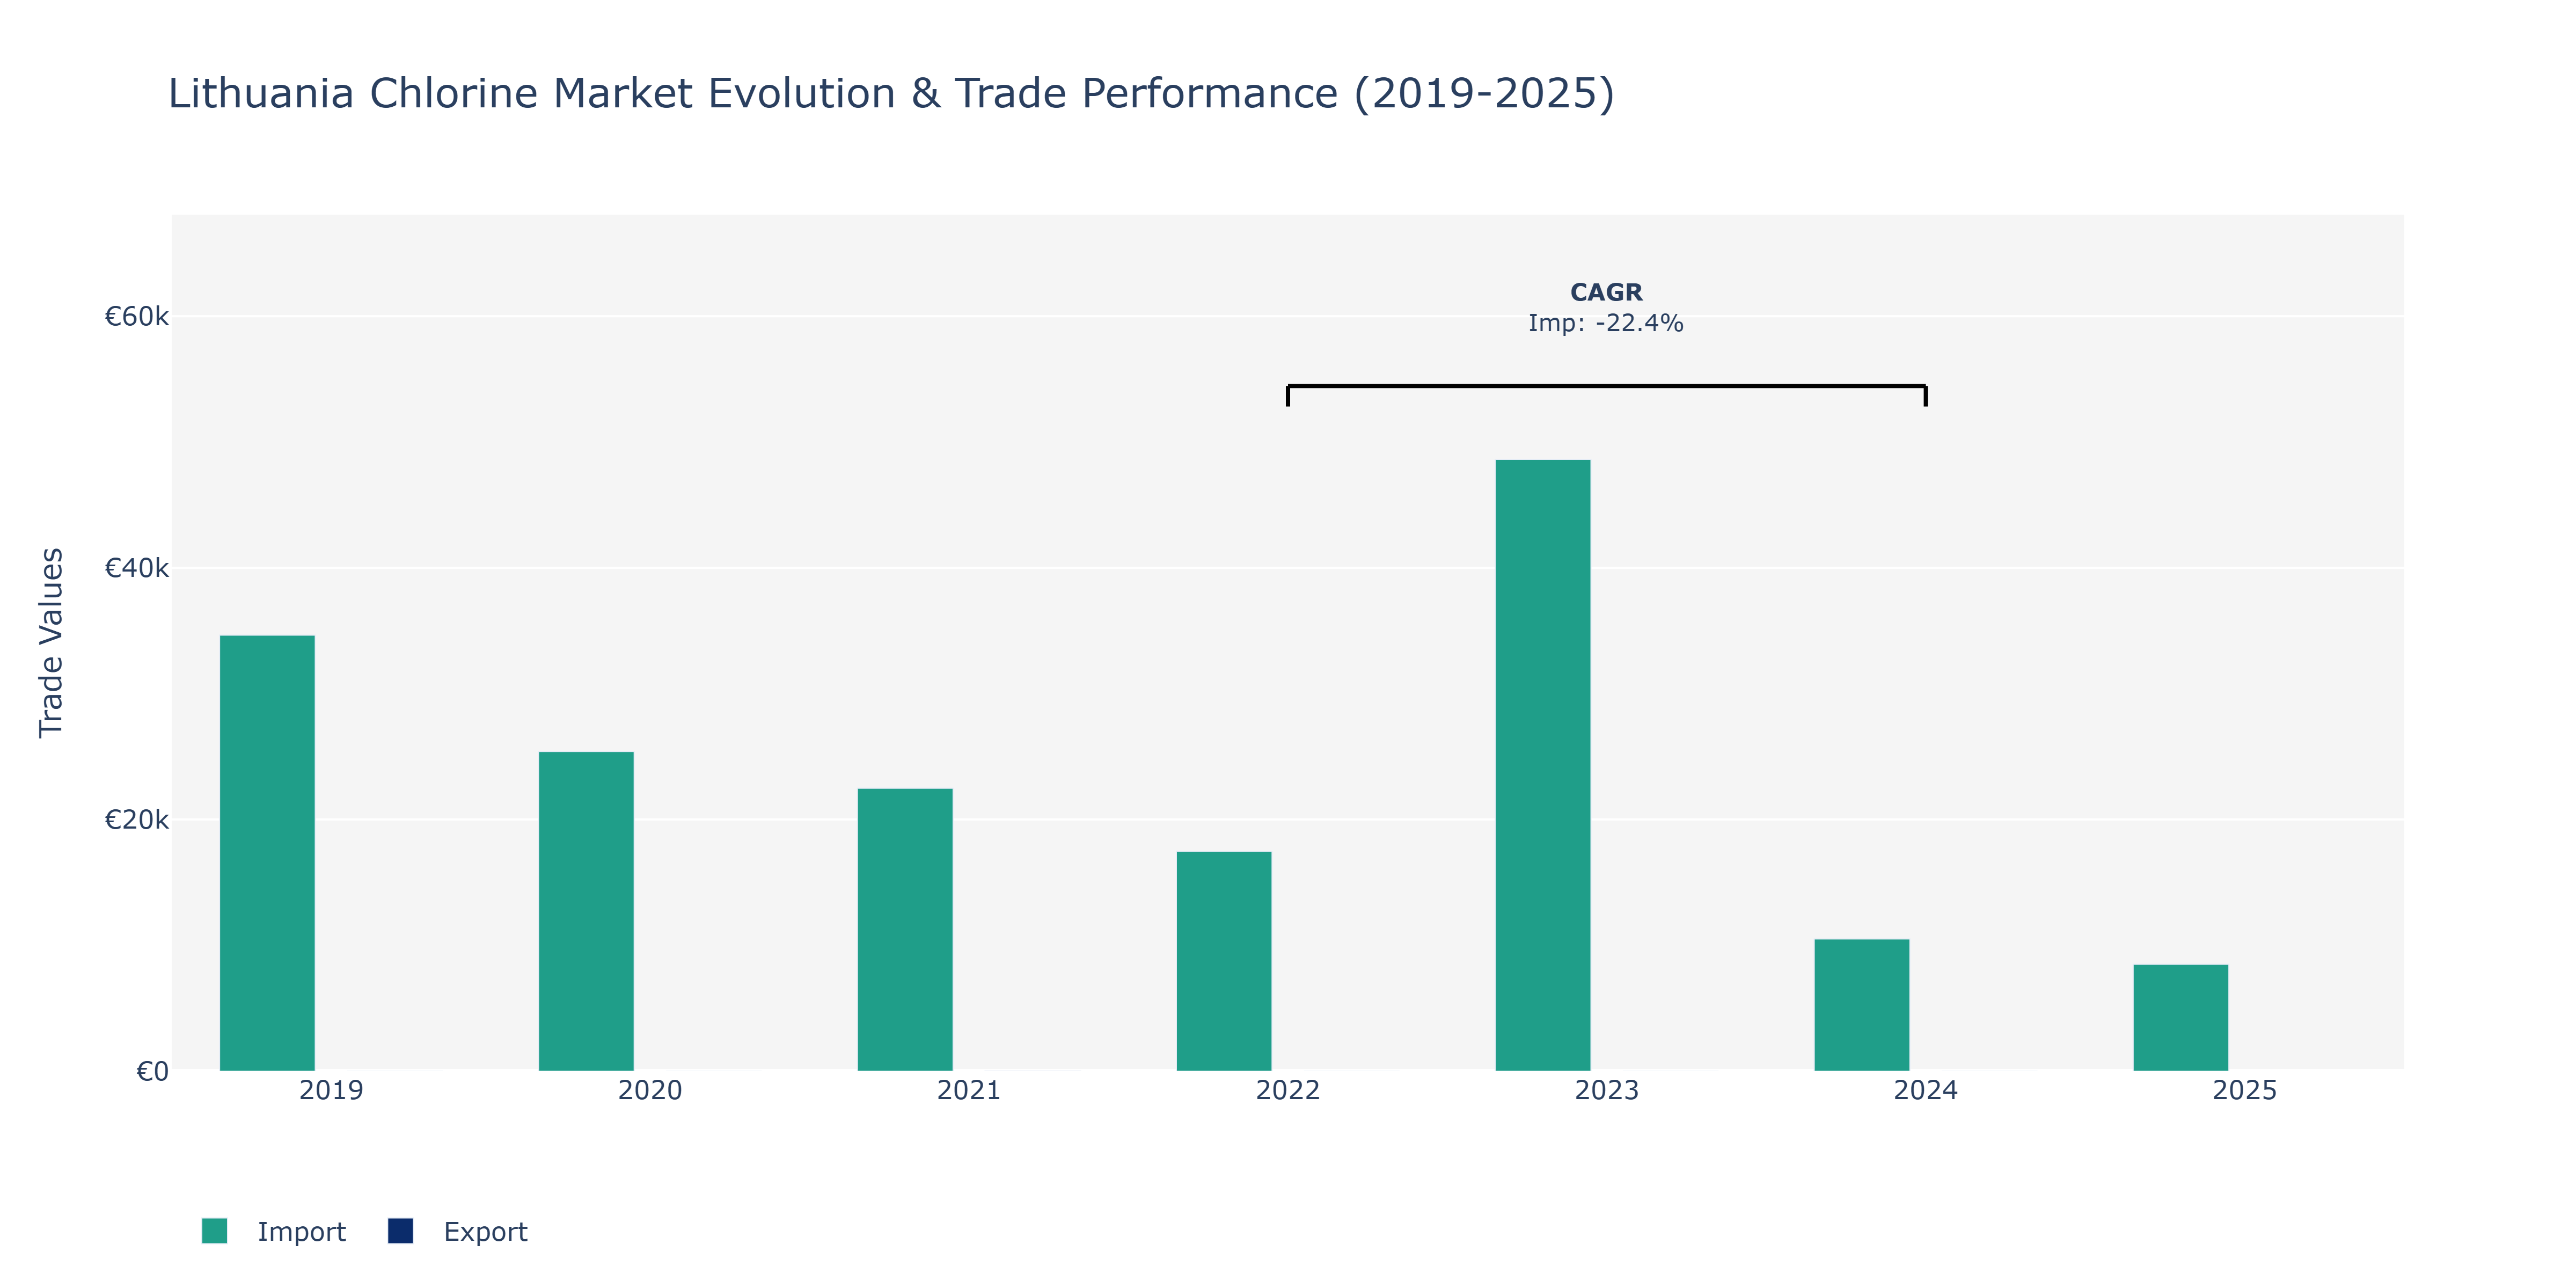
In the Lithuania Chlorine Market, imports exhibited notable fluctuations over the years. In 2019, imports were at €34.66 thousand, declining to €25.41 thousand in 2020. The trend continued in 2021 when imports dropped sharply to €22.49 thousand, possibly influenced by global economic uncertainties. However, a significant recovery occurred in 2023, with imports surging to €48.63 thousand, potentially driven by increased demand from various industries relying on chlorine-based products. The market saw a substantial decrease in 2024, with imports totaling €10.52 thousand, possibly reflecting a temporary shift in procurement strategies or market dynamics. By 2025, imports further decreased to €8.5 thousand, indicating a potential shift in sourcing patterns or changes in domestic production capacities. The fluctuations in imports reflect the market's sensitivity to external factors, highlighting the need for diversified sourcing strategies and resilient supply chains in the chlorine industry.
Key Highlights of the Report:
- Lithuania Chlorine Market Outlook
- Market Size of Lithuania Chlorine Market, 2025
- Forecast of Lithuania Chlorine Market, 2032
- Historical Data and Forecast of Lithuania Chlorine Revenues & Volume for the Period 2022 - 2032F
- Lithuania Chlorine Market Trend Evolution
- Lithuania Chlorine Market Drivers and Challenges
- Lithuania Chlorine Price Trends
- Lithuania Chlorine Porter`s Five Forces
- Lithuania Chlorine Industry Life Cycle
- Historical Data and Forecast of Lithuania Chlorine Market Revenues & Volume By Application for the Period 2022 - 2032F
- Historical Data and Forecast of Lithuania Chlorine Market Revenues & Volume By EDC/PVC for the Period 2022 - 2032F
- Historical Data and Forecast of Lithuania Chlorine Market Revenues & Volume By Isocyanates and Oxygenates for the Period 2022 - 2032F
- Historical Data and Forecast of Lithuania Chlorine Market Revenues & Volume By Chloromethanes for the Period 2022 - 2032F
- Historical Data and Forecast of Lithuania Chlorine Market Revenues & Volume By Solvents and Epichlorohydrin for the Period 2022 - 2032F
- Historical Data and Forecast of Lithuania Chlorine Market Revenues & Volume By Inorganic Chemicals for the Period 2022 - 2032F
- Historical Data and Forecast of Lithuania Chlorine Market Revenues & Volume By Other Applications for the Period 2022 - 2032F
- Historical Data and Forecast of Lithuania Chlorine Market Revenues & Volume By End-user for the Period 2022 - 2032F
- Historical Data and Forecast of Lithuania Chlorine Market Revenues & Volume By Water Treatment for the Period 2022 - 2032F
- Historical Data and Forecast of Lithuania Chlorine Market Revenues & Volume By Pharmaceutical for the Period 2022 - 2032F
- Historical Data and Forecast of Lithuania Chlorine Market Revenues & Volume By Chemicals for the Period 2022 - 2032F
- Historical Data and Forecast of Lithuania Chlorine Market Revenues & Volume By Paper and Pulp for the Period 2022 - 2032F
- Historical Data and Forecast of Lithuania Chlorine Market Revenues & Volume By Plastic for the Period 2022 - 2032F
- Historical Data and Forecast of Lithuania Chlorine Market Revenues & Volume By Pesticides for the Period 2022 - 2032F
- Historical Data and Forecast of Lithuania Chlorine Market Revenues & Volume By Other for the Period 2022 - 2032F
- Lithuania Chlorine Import Export Trade Statistics
- Market Opportunity Assessment By Application
- Market Opportunity Assessment By End-user
- Lithuania Chlorine Top Companies Market Share
- Lithuania Chlorine Competitive Benchmarking By Technical and Operational Parameters
- Lithuania Chlorine Company Profiles
- Lithuania Chlorine Key Strategic Recommendations
Frequently Asked Questions About the Market Study (FAQs):
6Wresearch actively monitors the Lithuania Chlorine Market and publishes its comprehensive annual report, highlighting emerging trends, growth drivers, revenue analysis, and forecast outlook. Our insights help businesses to make data-backed strategic decisions with ongoing market dynamics. Our analysts track relevent industries related to the Lithuania Chlorine Market, allowing our clients with actionable intelligence and reliable forecasts tailored to emerging regional needs.
Yes, we provide customisation as per your requirements. To learn more, feel free to contact us on sales@6wresearch.com
1 Executive Summary |
2 Introduction |
2.1 Key Highlights of the Report |
2.2 Report Description |
2.3 Market Scope & Segmentation |
2.4 Research Methodology |
2.5 Assumptions |
3 Lithuania Chlorine Market Overview |
3.1 Lithuania Country Macro Economic Indicators |
3.2 Lithuania Chlorine Market Revenues & Volume, 2022 & 2032F |
3.3 Lithuania Chlorine Market - Industry Life Cycle |
3.4 Lithuania Chlorine Market - Porter's Five Forces |
3.5 Lithuania Chlorine Market Revenues & Volume Share, By Application, 2022 & 2032F |
3.6 Lithuania Chlorine Market Revenues & Volume Share, By End-user, 2022 & 2032F |
4 Lithuania Chlorine Market Dynamics |
4.1 Impact Analysis |
4.2 Market Drivers |
4.2.1 Increasing demand for chlorine in water treatment applications due to growing concerns about water pollution and sanitation. |
4.2.2 Growth in the chemical industry in Lithuania, leading to higher consumption of chlorine as a raw material. |
4.2.3 Rising awareness about the benefits of chlorine in disinfection and sanitation across various industries. |
4.3 Market Restraints |
4.3.1 Fluctuating prices of raw materials used in chlorine production, affecting the overall cost of production. |
4.3.2 Stringent environmental regulations and concerns about the impact of chlorine on the environment, leading to restrictions on its usage. |
4.3.3 Competition from alternative water treatment technologies that are perceived to be more environmentally friendly. |
5 Lithuania Chlorine Market Trends |
6 Lithuania Chlorine Market Segmentations |
6.1 Lithuania Chlorine Market, By Application |
6.1.1 Overview and Analysis |
6.1.2 Lithuania Chlorine Market Revenues & Volume, By EDC/PVC, 2022 - 2032F |
6.1.3 Lithuania Chlorine Market Revenues & Volume, By Isocyanates and Oxygenates, 2022 - 2032F |
6.1.4 Lithuania Chlorine Market Revenues & Volume, By Chloromethanes, 2022 - 2032F |
6.1.5 Lithuania Chlorine Market Revenues & Volume, By Solvents and Epichlorohydrin, 2022 - 2032F |
6.1.6 Lithuania Chlorine Market Revenues & Volume, By Inorganic Chemicals, 2022 - 2032F |
6.1.7 Lithuania Chlorine Market Revenues & Volume, By Other Applications, 2022 - 2032F |
6.2 Lithuania Chlorine Market, By End-user |
6.2.1 Overview and Analysis |
6.2.2 Lithuania Chlorine Market Revenues & Volume, By Water Treatment, 2022 - 2032F |
6.2.3 Lithuania Chlorine Market Revenues & Volume, By Pharmaceutical, 2022 - 2032F |
6.2.4 Lithuania Chlorine Market Revenues & Volume, By Chemicals, 2022 - 2032F |
6.2.5 Lithuania Chlorine Market Revenues & Volume, By Paper and Pulp, 2022 - 2032F |
6.2.6 Lithuania Chlorine Market Revenues & Volume, By Plastic, 2022 - 2032F |
6.2.7 Lithuania Chlorine Market Revenues & Volume, By Pesticides, 2022 - 2032F |
7 Lithuania Chlorine Market Import-Export Trade Statistics |
7.1 Lithuania Chlorine Market Export to Major Countries |
7.2 Lithuania Chlorine Market Imports from Major Countries |
8 Lithuania Chlorine Market Key Performance Indicators |
8.1 Chlorine consumption in water treatment plants. |
8.2 Number of new applications or industries adopting chlorine-based solutions. |
8.3 Investment in research and development for chlorine-related products and technologies. |
8.4 Adoption rate of chlorine-based products compared to alternatives. |
8.5 Regulatory compliance and environmental impact assessments related to chlorine usage. |
9 Lithuania Chlorine Market - Opportunity Assessment |
9.1 Lithuania Chlorine Market Opportunity Assessment, By Application, 2022 & 2032F |
9.2 Lithuania Chlorine Market Opportunity Assessment, By End-user, 2022 & 2032F |
10 Lithuania Chlorine Market - Competitive Landscape |
10.1 Lithuania Chlorine Market Revenue Share, By Companies, 2025 |
10.2 Lithuania Chlorine Market Competitive Benchmarking, By Operating and Technical Parameters |
11 Company Profiles |
12 Recommendations | 13 Disclaimer |
Global Go To Market Strategy - 2030
Export potential enables firms to identify high-growth global markets with greater confidence by combining advanced trade intelligence with a structured quantitative methodology. The framework analyzes emerging demand trends and country-level import patterns while integrating macroeconomic and trade datasets such as GDP and population forecasts, bilateral import–export flows, tariff structures, elasticity differentials between developed and developing economies, geographic distance, and import demand projections. Using weighted trade values from 2020–2024 as the base period to project country-to-country export potential for 2030, these inputs are operationalized through calculated drivers such as gravity model parameters, tariff impact factors, and projected GDP per-capita growth. Through an analysis of hidden potentials, demand hotspots, and market conditions that are most favorable to success, this method enables firms to focus on target countries, maximize returns, and global expansion with data, backed by accuracy.
By factoring in the projected importer demand gap that is currently unmet and could be potential opportunity, it identifies the potential for the Exporter (Country) among 190 countries, against the general trade analysis, which identifies the biggest importer or exporter.
To discover high-growth global markets and optimize your business strategy:
Click Here
Pricing
- Single User License$ 1,995
- Department License$ 2,400
- Site License$ 3,120
- Global License$ 3,795

Leadership Perspectives from Industry Events
Search
Thought Leadership and Analyst Meet


Our Clients
6WResearch In News
- India Export Attractiveness Tracker 2026
- India Air Conditioner Market Set for Strong Rebound in 2026 After Weather-Led Correction and GST-Driven Recovery: 6Wresearch
- ADAS in India: How Automatic Emergency Braking, Blind Spot Detection & Driver Monitoring are Transforming Road Safety
- Doha a strategic location for EV manufacturing hub: IPA Qatar
- Demand for luxury TVs surging in the GCC, says Samsung
- Empowering Growth: The Thriving Journey of Bangladesh’s Cable Industry
Latest Reports
- Nicaragua RPG Gaming Market (2026-2032)
- New Zealand RPG Gaming Market (2026-2032)
- Netherlands RPG Gaming Market (2026-2032)
- Nauru RPG Gaming Market (2026-2032)
- Namibia RPG Gaming Market (2026-2032)
- Mozambique RPG Gaming Market (2026-2032)
- Montenegro RPG Gaming Market (2026-2032)
- Mongolia RPG Gaming Market (2026-2032)
- Monaco RPG Gaming Market (2026-2032)
- Micronesia RPG Gaming Market (2026-2032)
Industry Events and Analyst Meet

EV India Expo 2026

HIMTEX 2026

India Refining Summit 2026

India EV Show 2026

EV tech India Expo 2026
Whitepaper
- Middle East & Africa Commercial Security Market Click here to view more.
- Middle East & Africa Fire Safety Systems & Equipment Market Click here to view more.
- GCC Drone Market Click here to view more.
- Middle East Lighting Fixture Market Click here to view more.
- GCC Physical & Perimeter Security Market Click here to view more.