Georgia Rubber Market (2026-2032) | Value, Forecast, Industry, Trends, Companies, Analysis, Size, Growth, Revenue, Share & Outlook
Market Forecast By Product Type (Natural Rubber, Synthetic Rubber), By End-users (Automotive & Transportation, Building & Construction, Industrial Machinery & Equipment, Others) And Competitive Landscape
| Product Code: ETC037841 | Publication Date: Jan 2021 | Updated Date: Jun 2026 | Product Type: Report | |
| Publisher: 6Wresearch | Author: Bhawna Singh | No. of Pages: 70 | No. of Figures: 35 | No. of Tables: 5 |
Georgia Rubber Market Summary
The georgia rubber market was estimated at USD 281 Million in 2025 and is projected to reach USD 391 Million by 2032, growing at a CAGR of 5.9% from 2026 to 2032.
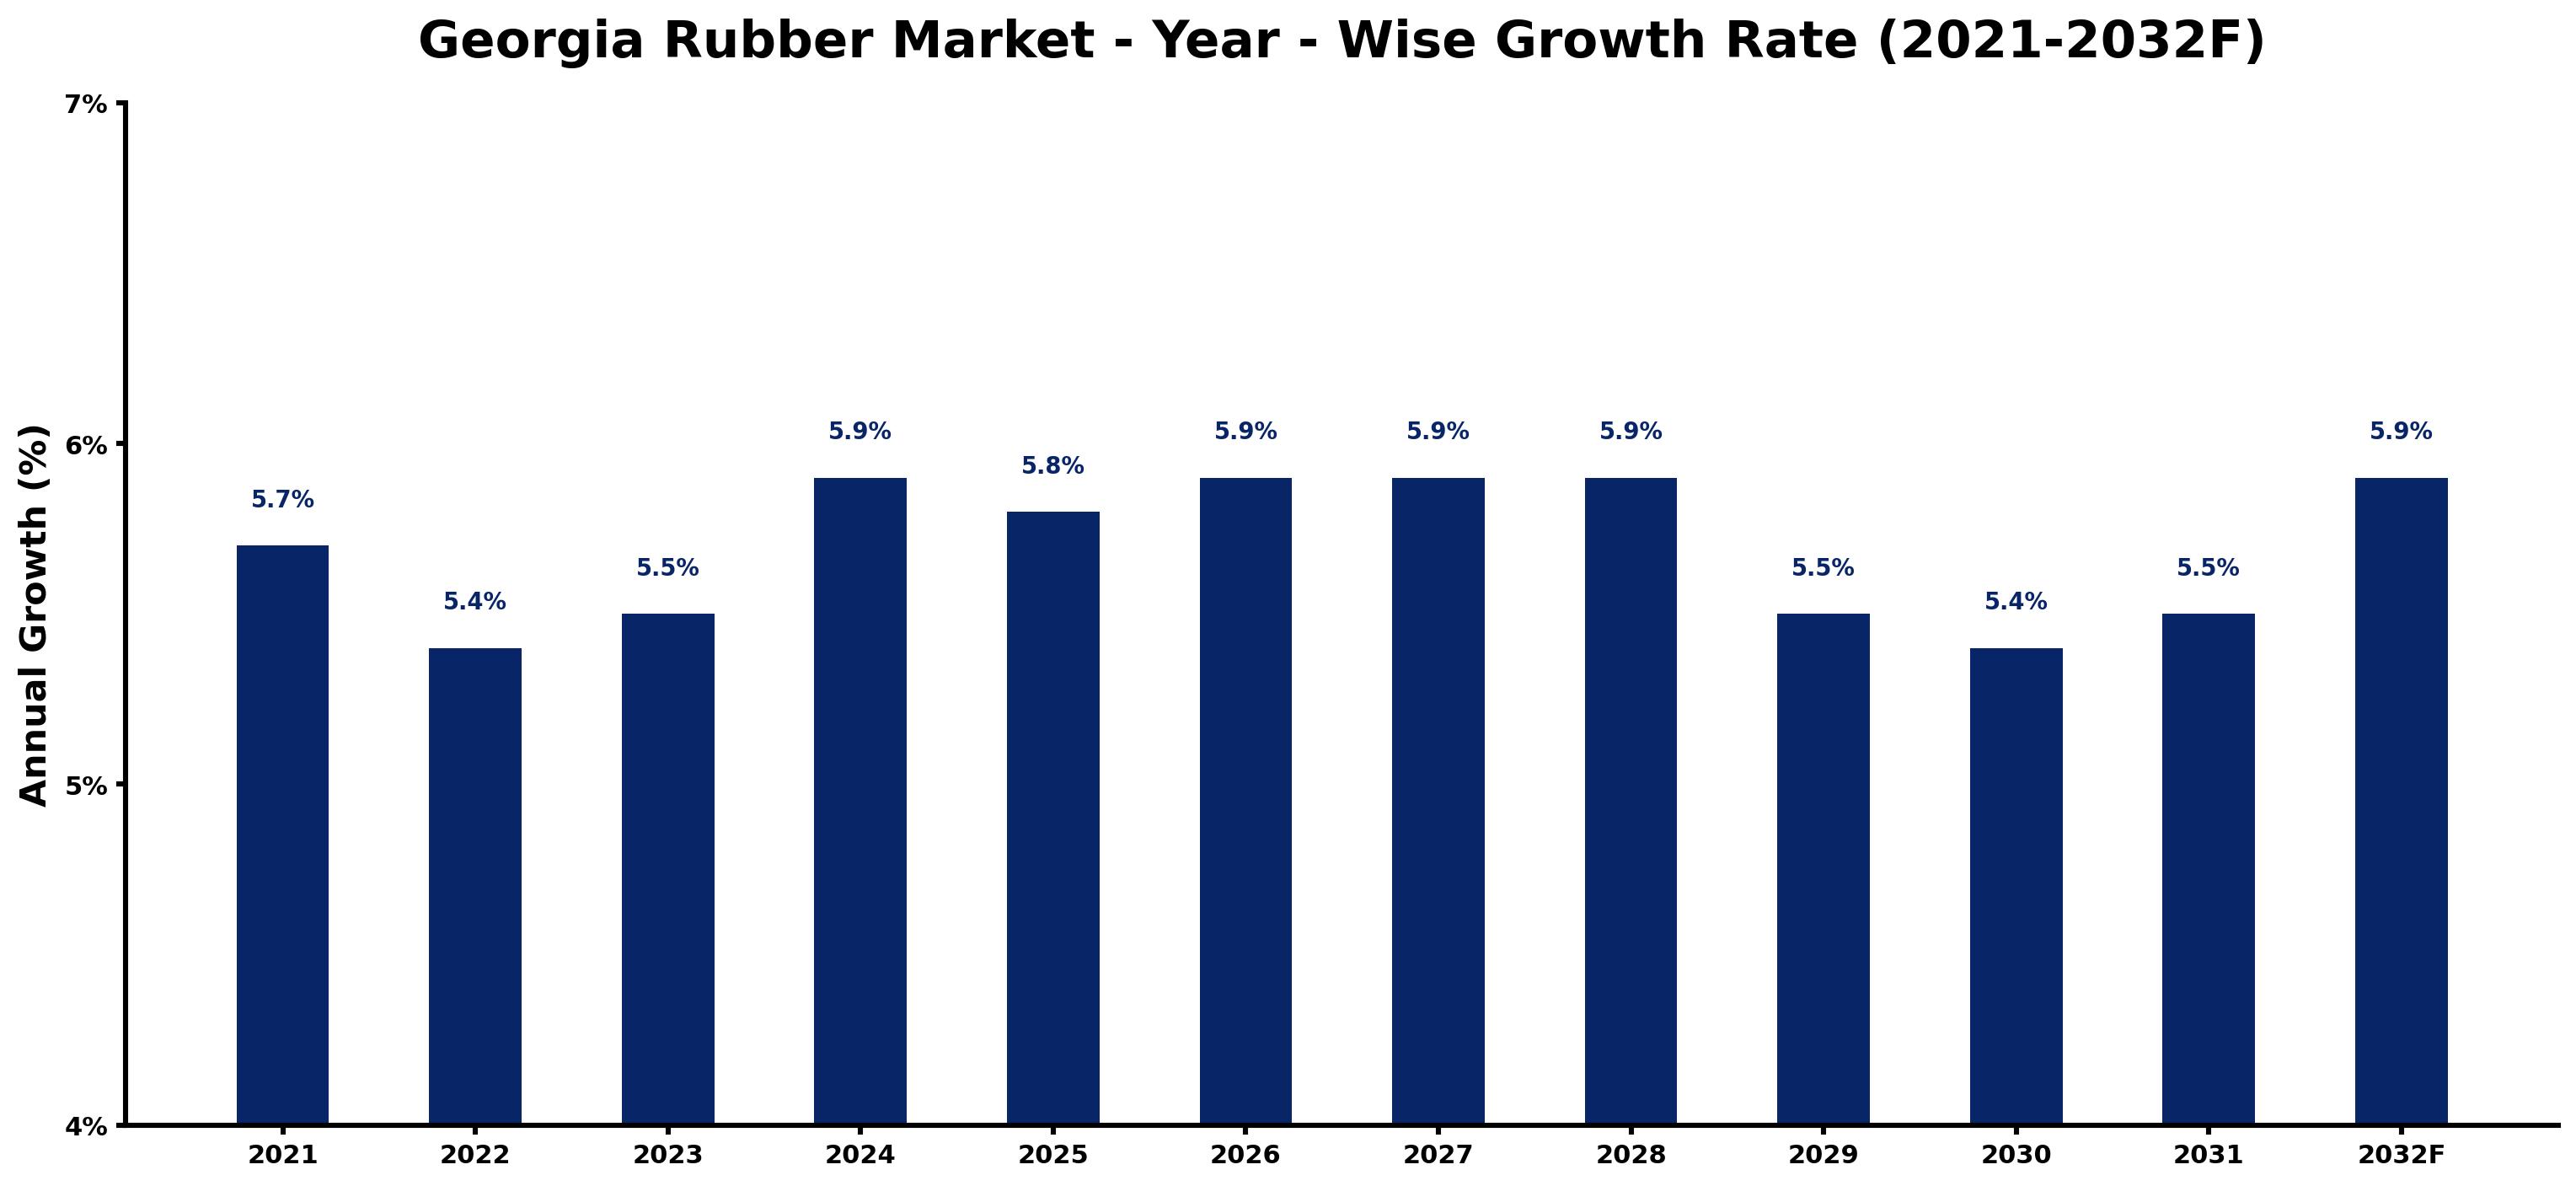
Georgia Rubber Market Growth Rate Analysis (2021-2032)
The Georgia Rubber market has showcased a stable growth pattern, with a consistent increase in demand driven by industrial applications and consumer preferences. In 2021, the market grew by 5.7%, slightly easing to 5.4% in 2022 due to supply chain disruptions. However, as production efficiency recovered, growth rebounded to 5.5% in 2023 and is projected to reach 5.9% by 2024. Factors such as heightened consumer demand for sustainable products and advancements in rubber manufacturing technology contribute to this positivity. Over the following years, growth stabilizes around 5.9% until 2028, before dipping slightly in 2029 and 2030, likely due to market saturation and economic fluctuations. Investments in infrastructure and energy transition efforts are expected to further reinforce this upward trajectory through 2032.
Georgia Rubber Market Year-wise Growth Rate and Key Drivers
This graph highlights how the Georgia Rubber Market has steadily grown over the past five years, supported by major growth factors.
The table below presents the year wise growth rates along with the key drivers influencing the market
| Year | Growth Rate | Major Drivers |
| 2021 | 5.7% | Market players focused on enhancing product durability to meet local consumer demands. |
| 2022 | 5.4% | Investments in sustainable practices gained traction, influencing supply chain strategies significantly. |
| 2023 | 5.5% | Local manufacturers increasingly catered to automotive sectors, boosting regional rubber production rates. |
| 2024 | 5.9% | Collaboration with tech firms improved manufacturing efficiencies in rubber processing facilities. |
| 2025 | 5.8% | Emerging construction projects prioritized high-performance materials for longer-lasting infrastructure solutions. |
| 2026 | 5.9% | Innovative recycling technologies transformed waste management within the rubber industry landscape. |
| 2027 | 5.9% | Consumer preference shifted towards eco-friendly alternatives, reshaping market offerings distinctly. |
| 2028 | 5.9% | International trade agreements opened export avenues, expanding market reach beyond Georgia's borders. |
| 2029 | 5.5% | Investment in research aimed at enhancing resilience against extreme weather conditions intensified. |
| 2030 | 5.4% | Partnerships formed with logistics providers streamlined distribution processes for rubber products. |
| 2031 | 5.5% | Technological advancements led to the emergence of smart rubber applications in diverse sectors. |
| 2032 | 5.9% | Market consolidation trends resulted in fewer, stronger players capable of driving innovation. |
Note - Market size estimations and growth projections presented in this report are based on 6Wresearch's advanced forecasting approach, validated with industry datasets as of June 2026.
Georgia Rubber Market Synopsis
The Georgia Rubber Market is projected to reach 5.9% and witness significant growth during the forecast period (2026-2032). Positioned as a critical segment within the state's agricultural sector, the market is characterized by its robust emphasis on natural rubber production. The southern region of Georgia, benefiting from a subtropical climate and fertile soil, serves as the primary locus for rubber plantations, enabling optimal growth conditions for rubber trees.
Georgia Rubber Market Growth Drivers
Several factors are driving the Georgia Rubber Market forward. These include:
- Increasing demand from various industries is a primary driver, with automotive, construction, and healthcare sectors continuously seeking high-quality rubber products for manufacturing and innovation.
- The state government's proactive policies aimed at bolstering sustainable rubber cultivation practices help stimulate growth by ensuring long-term viability and environmental stewardship.
- Technological advancements in production processes enhance efficiency and output, allowing producers to meet rising demands while maintaining competitiveness.
- Job creation and economic development in rural areas are significant factors that enrich local economies, making rubber production not just an economic activity but a social one as well.
- An emphasis on improved quality and sustainability is reshaping market dynamics, with a notable shift towards rubber products that meet eco-friendly standards.
Georgia Rubber Market Trends and Opportunities
The Georgia Rubber Market is witnessing a transformation driven by a collective move toward sustainability. This trend is characterized by:
- A heightened consumer awareness concerning environmental issues leads to an increase in demand for responsibly sourced rubber products, prompting businesses to adapt their practices.
- Sustainable practices, including the use of recycled materials and energy-efficient technologies in production, are becoming integral in maintaining market relevance.
- Investment opportunities in R&D for innovative rubber cultivation and processing techniques are emerging, promising to enhance yield and quality.
- The development of products that minimize environmental impact throughout their life cycle—from production to disposal—is gaining traction in the marketplace.
- Greater collaboration within the industry can lead to shared best practices that foster resilience against market fluctuations and external pressures.
Georgia Rubber Market Challenges and Restraints
Despite its many opportunities, the Georgia Rubber Market faces significant challenges:
- Fluctuations in global rubber prices can create instability for local producers, making it difficult to maintain profit margins and predict future trends.
- Competition from synthetic rubber substitutes poses a threat as manufacturers weigh the cost-effectiveness of alternatives versus natural rubber.
- Natural disasters, such as hurricanes and droughts, can severely impact rubber plantations, leading to supply chain disruptions and economic losses.
- Environmental regulations related to land use and sustainability may impose additional costs and operational challenges for rubber producers in Georgia.
- Navigating the complexities of international trade may introduce additional hurdles, particularly regarding tariffs and trade agreements affecting the rubber market.
Georgia Rubber Market Government Investment and Initiatives
The Georgia government has introduced several initiatives aimed at enhancing the rubber market's growth and sustainability. Key government policies include:
- Subsidies and incentives for farmers adopting sustainable cultivation methods, encouraging environmentally friendly practices while improving productivity.
- Financial assistance programs to bolster infrastructure development, enhancing transportation and distribution networks for rubber products.
- Quality standards regulations that ensure only the best products enter the market, thereby increasing consumer confidence in Georgia's rubber production.
- Research grants that support innovation in rubber cultivation techniques, facilitating improvements that lead to higher yields and more sustainable practices.
- Collaborative programs with agricultural institutions to disseminate knowledge and advancements in rubber production and processing, benefiting local communities.
Georgia Rubber Market Latest Developments (May 2025 - June 2026)
In the period between May 2025 and June 2026, the Georgia Rubber Market has been characterized by several notable developments:
- Increased adoption of sustainable practices by various stakeholders in the rubber supply chain, reflecting a broader commitment to responsible production.
- Technological advancements aimed at improving efficiency in rubber processing have gained traction, offering better yield and quality of products.
- New collaborative efforts among local producers have emerged, focusing on sharing best practices and introducing innovative solutions to market challenges.
- Regulatory updates regarding sustainability and environmental practices have prompted producers to enhance compliance measures and adopt green technologies.
- Growing interest from investors in the Georgia Rubber Market, driven by the increasing global demand for sustainable rubber products across various sectors.
Georgia Rubber Market - Key Attractiveness of the Report
- 10 Years of Market Numbers
- Historical Data Starting from 2022 to 2025
- Base Year: 2025
- Forecast Data until 2032
- Key Performance Indicators Impacting the Market
- Major Upcoming Developments and Projects
Key Highlights of the Report:
- Georgia Rubber Market Outlook
- Market Size of Georgia Rubber Market, 2025
- Forecast of Georgia Rubber Market, 2032F
- Historical Data and Forecast of Georgia Rubber Revenues & Volume for the Period 2022-2032F
- Georgia Rubber Market Trend Evolution
- Georgia Rubber Market Drivers and Challenges
- Georgia Rubber Price Trends
- Georgia Rubber Porter's Five Forces
- Georgia Rubber Industry Life Cycle
- Historical Data and Forecast of Georgia Rubber Market Revenues & Volume By Product Type for the Period 2022-2032F
- Historical Data and Forecast of Georgia Rubber Market Revenues & Volume By Natural Rubber for the Period 2022-2032F
- Historical Data and Forecast of Georgia Rubber Market Revenues & Volume By Synthetic Rubber for the Period 2022-2032F
- Historical Data and Forecast of Georgia Rubber Market Revenues & Volume By End-users for the Period 2022-2032F
- Historical Data and Forecast of Georgia Rubber Market Revenues & Volume By Automotive & Transportation for the Period 2022-2032F
- Historical Data and Forecast of Georgia Rubber Market Revenues & Volume By Building & Construction for the Period 2022-2032F
- Historical Data and Forecast of Georgia Rubber Market Revenues & Volume By Industrial Machinery & Equipment for the Period 2022-2032F
- Historical Data and Forecast of Georgia Rubber Market Revenues & Volume By Others for the Period 2022-2032F
- Georgia Rubber Import Export Trade Statistics
- Market Opportunity Assessment By Product Type
- Market Opportunity Assessment By End-users
- Georgia Rubber Top Companies Market Share
- Georgia Rubber Competitive Benchmarking By Technical and Operational Parameters
- Georgia Rubber Company Profiles
- Georgia Rubber Key Strategic Recommendations
Frequently Asked Questions About the Market Study (FAQs):
The growth is primarily driven by increasing demand from key industries, sustainable practices, and government support for the rubber production sector.
Challenges include fluctuations in global prices, competition from synthetic rubber, and vulnerabilities due to natural disasters.
The government supports the market through subsidies, financial assistance for infrastructure, and incentives for sustainable practices among producers.
The market is expected to grow steadily, with advancements in technology and increasing global demand for sustainable rubber products contributing to its positive outlook.
6Wresearch actively monitors the Georgia Rubber Market and publishes its comprehensive annual report, highlighting emerging trends, growth drivers, revenue analysis, and forecast outlook. Our insights help businesses to make data-backed strategic decisions with ongoing market dynamics. Our analysts track relevent industries related to the Georgia Rubber Market, allowing our clients with actionable intelligence and reliable forecasts tailored to emerging regional needs.
Yes, we provide customisation as per your requirements. To learn more, feel free to contact us on sales@6wresearch.com
1 Executive Summary |
2 Introduction |
2.1 Key Highlights of the Report |
2.2 Report Description |
2.3 Market Scope & Segmentation |
2.4 Research Methodology |
2.5 Assumptions |
3 Georgia Rubber Market Overview |
3.1 Georgia Country Macro Economic Indicators |
3.2 Georgia Rubber Market Revenues & Volume, 2022 & 2032F |
3.3 Georgia Rubber Market - Industry Life Cycle |
3.4 Georgia Rubber Market - Porter's Five Forces |
3.5 Georgia Rubber Market Revenues & Volume Share, By Product Type, 2022 & 2032F |
3.6 Georgia Rubber Market Revenues & Volume Share, By End-users, 2022 & 2032F |
4 Georgia Rubber Market Dynamics |
4.1 Impact Analysis |
4.2 Market Drivers |
4.3 Market Restraints |
5 Georgia Rubber Market Trends |
6 Georgia Rubber Market, By Types |
6.1 Georgia Rubber Market, By Product Type |
6.1.1 Overview and Analysis |
6.1.2 Georgia Rubber Market Revenues & Volume, By Product Type, 2022-2032F |
6.1.3 Georgia Rubber Market Revenues & Volume, By Natural Rubber, 2022-2032F |
6.1.4 Georgia Rubber Market Revenues & Volume, By Synthetic Rubber, 2022-2032F |
6.2 Georgia Rubber Market, By End-users |
6.2.1 Overview and Analysis |
6.2.2 Georgia Rubber Market Revenues & Volume, By Automotive & Transportation, 2022-2032F |
6.2.3 Georgia Rubber Market Revenues & Volume, By Building & Construction, 2022-2032F |
6.2.4 Georgia Rubber Market Revenues & Volume, By Industrial Machinery & Equipment, 2022-2032F |
6.2.5 Georgia Rubber Market Revenues & Volume, By Others, 2022-2032F |
7 Georgia Rubber Market Import-Export Trade Statistics |
7.1 Georgia Rubber Market Export to Major Countries |
7.2 Georgia Rubber Market Imports from Major Countries |
8 Georgia Rubber Market Key Performance Indicators |
9 Georgia Rubber Market - Opportunity Assessment |
9.1 Georgia Rubber Market Opportunity Assessment, By Product Type, 2022 & 2032F |
9.2 Georgia Rubber Market Opportunity Assessment, By End-users, 2022 & 2032F |
10 Georgia Rubber Market - Competitive Landscape |
10.1 Georgia Rubber Market Revenue Share, By Companies, 2025 |
10.2 Georgia Rubber Market Competitive Benchmarking, By Operating and Technical Parameters |
11 Company Profiles |
12 Recommendations |
13 Disclaimer |
Global Go To Market Strategy - 2030
Export potential enables firms to identify high-growth global markets with greater confidence by combining advanced trade intelligence with a structured quantitative methodology. The framework analyzes emerging demand trends and country-level import patterns while integrating macroeconomic and trade datasets such as GDP and population forecasts, bilateral import–export flows, tariff structures, elasticity differentials between developed and developing economies, geographic distance, and import demand projections. Using weighted trade values from 2020–2024 as the base period to project country-to-country export potential for 2030, these inputs are operationalized through calculated drivers such as gravity model parameters, tariff impact factors, and projected GDP per-capita growth. Through an analysis of hidden potentials, demand hotspots, and market conditions that are most favorable to success, this method enables firms to focus on target countries, maximize returns, and global expansion with data, backed by accuracy.
By factoring in the projected importer demand gap that is currently unmet and could be potential opportunity, it identifies the potential for the Exporter (Country) among 190 countries, against the general trade analysis, which identifies the biggest importer or exporter.
To discover high-growth global markets and optimize your business strategy:
Click Here
Pricing
- Single User License$ 1,995
- Department License$ 2,400
- Site License$ 3,120
- Global License$ 3,795

Leadership Perspectives from Industry Events
Search
Thought Leadership and Analyst Meet


Our Clients
6WResearch In News
- India Air Conditioner Market Set for Strong Rebound in 2026 After Weather-Led Correction and GST-Driven Recovery: 6Wresearch
- ADAS in India: How Automatic Emergency Braking, Blind Spot Detection & Driver Monitoring are Transforming Road Safety
- Doha a strategic location for EV manufacturing hub: IPA Qatar
- Demand for luxury TVs surging in the GCC, says Samsung
- Empowering Growth: The Thriving Journey of Bangladesh’s Cable Industry
- Demand for luxury TVs surging in the GCC, says Samsung
Latest Reports
- Poland Fire Protection Systems Market (2026-2032)
- Cape Verde Portable Hand-Thrown Extinguisher Market (2026-2032)
- Canada Portable Hand-Thrown Extinguisher Market (2026-2032)
- Cameroon Portable Hand-Thrown Extinguisher Market (2026-2032)
- Burundi Portable Hand-Thrown Extinguisher Market (2026-2032)
- Burkina Faso Portable Hand-Thrown Extinguisher Market (2026-2032)
- Bulgaria Portable Hand-Thrown Extinguisher Market (2026-2032)
- Brunei Portable Hand-Thrown Extinguisher Market (2026-2032)
- Botswana Portable Hand-Thrown Extinguisher Market (2026-2032)
- Bosnia and Herzegovina Portable Hand-Thrown Extinguisher Market (2026-2032)
Industry Events and Analyst Meet

HIMTEX 2026

India Refining Summit 2026

India EV Show 2026

EV tech India Expo 2026

Auto Tech Asia 2026
Whitepaper
- Middle East & Africa Commercial Security Market Click here to view more.
- Middle East & Africa Fire Safety Systems & Equipment Market Click here to view more.
- GCC Drone Market Click here to view more.
- Middle East Lighting Fixture Market Click here to view more.
- GCC Physical & Perimeter Security Market Click here to view more.